Analyzing Public Miners with Breakeven Hashprice

In this piece, we describe the hashprice metric and introduce a methodology for how hashprice can be used to assess the breakeven thresholds for mining operations of all kinds, even those with diversified revenue streams. Access our spreadsheet breakeven calculator here.
Key Takeaways
Quantifying miners’ robustness to increases in hashrate or drops in price can be unintuitive.
We propose an indicator called breakeven hashprice, which measures the threshold below which miners begin operating unprofitably.
This figure factors in operational costs like power and hosting costs, payroll (excluding any employee stock-based compensation), and selling, general and administrative (SG&A) expenses, as well as interest expense as a non-operating expense.
We also open-source our spreadsheet for calculating this figure from public filings and apply it to a set of public companies.
Introduction
In the current bitcoin mining environment, where we are observing rising network hashrate and a declining bitcoin price, it could be useful to have a framework for understanding the breakeven pricing of hashrate for mining companies. Breakeven metrics are used in a wide variety of commodity based industries such as oil and gas and gold mining and serve as key relative efficiency metrics for industry participants. In this blog we will walk through the concept of hashprice, what it is, how to calculate it, and how we can use hashprice to gain insight into breakeven thresholds for miners. At its simplest, hashprice is the market value of one unit of hashpower measured in dollars per terahash. You can think of hashprice as being analogous to the value of WTI crude oil for the oil and gas industry.
In regards to formulating and defining breakeven hashprice, it can be thought of as the minimum hashprice a company needs in order to cover its cost of electricity, interest expense, salaries and other cost of revenues. Breakeven hashprice as a metric can help measure a mining operation’s robustness to changes in price and network hashrate and can easily be calculatedfor any public mining operation even if they have diversified business lines based on their filings. This methodology is then applied to a sample set of public miners to estimate a cost curve for these companies. This article is accompanied by an open-source spreadsheet for performing these calculations on public miners.
Methodology
The methodology for calculating breakeven hashprice is broken out into two steps.
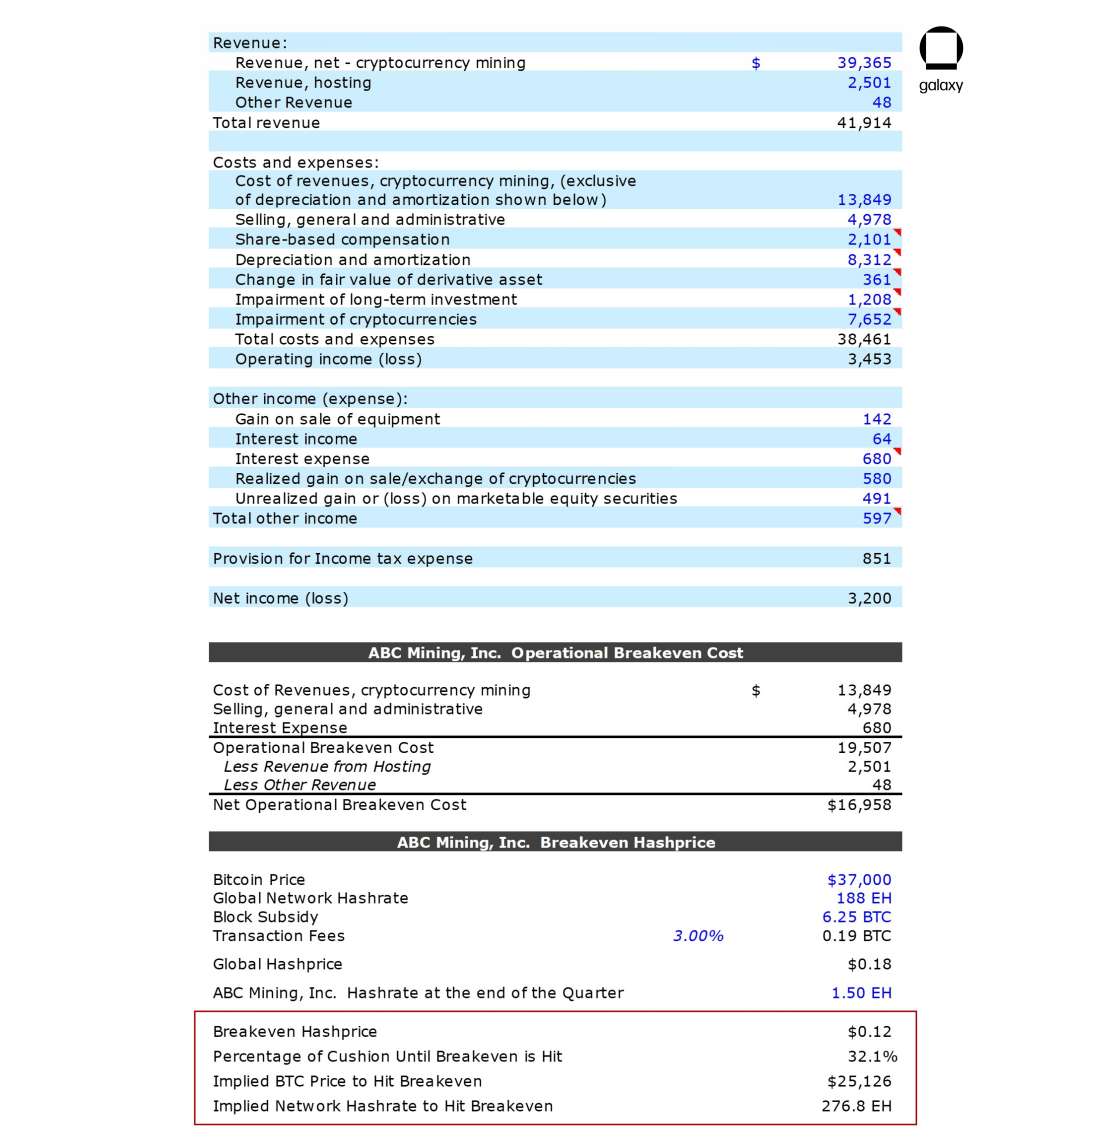
The first step is to calculate a firm’s operational breakeven cost to mine a bitcoin. This figure includes cost of revenues (or power and hosting costs), selling, general and administrative (SG&A) expenses (excluding employee stock-based compensation), and interest expense.
The intent of the operational breakeven cost is to capture all expenditures that require a real cash outlay while also accounting for a company’s capital structure. It is important to address how companies finance their operations, and therefore the reason why interest expense is included in the calculation. It is also important to exclude any non-recurring or one-time costs such as acquisition-related expenses, for example.
If the company being evaluated generates revenue from other business lines such as hosting or equipment sales it would be best to refer to their segment reported financials. If the company does not provide segment reported financials you can simply subtract the other sources of revenue from the operational breakeven cost to isolate how much revenue would need to be generated solely from mining to cover the remaining cost. In the event that the other sources of revenue cover the operating costs of the company then this suggests the company is diversified to a point where mining isn’t a significant contributor to the operational health of the company.
Over time it is likely that miners will expand into other lines of business to diversify their revenue streams and this methodology is reflexive to that dynamic.
Next, the company’s breakeven hashprice can be determined by taking the company’s operational breakeven cost divided by the number of days in the quarter (91.25 days as a proxy) divided by their hashrate in terahashes. This figure serves as a more defensible estimate of the viability of a new project, and represents the dollar-denominated minimum daily revenue per TH/s needed before the company would start losing money solely from its mining operation.
One can then determine the implied bitcoin price or network hashrate at which the company’s breakeven hashprice would equal the network hashprice. Below this point, the company would be mining unprofitably.
When analyzing this metric overtime, you will observe that a company’s breakeven hashprice will decline if it increases its hashrate by more than its expenses and conversely the breakeven point will increase if expenses grow by more than hashrate.

Analysis
By construction, breakeven hashprice only accounts for the cost inputs of a miner’s operation, and does not attempt to model network and market conditions, which are more complex. Still, a rough understanding of the dynamics behind mining revenue can be helpful in assessing the viability of a project with a certain breakeven point. In fact, much of the value of breakeven hashprice lies in the ease of comparing it to an existing metric, network hashprice.
Network hashprice (typically referred to simply as hashprice, but here prefixed for clarity) measures expected daily mining revenue per terahash per second, in dollar terms. Assuming normal market and network conditions, this figure is the same for all network participants.
Network hashprice can be used to understand the fair value of hashrate, especially in response to changes to bitcoin’s price, block rewards, and network hashrate. Because this indicator is critical for measuring current profitability and forecasting expected revenue, it’s become quite popular in mining circles.
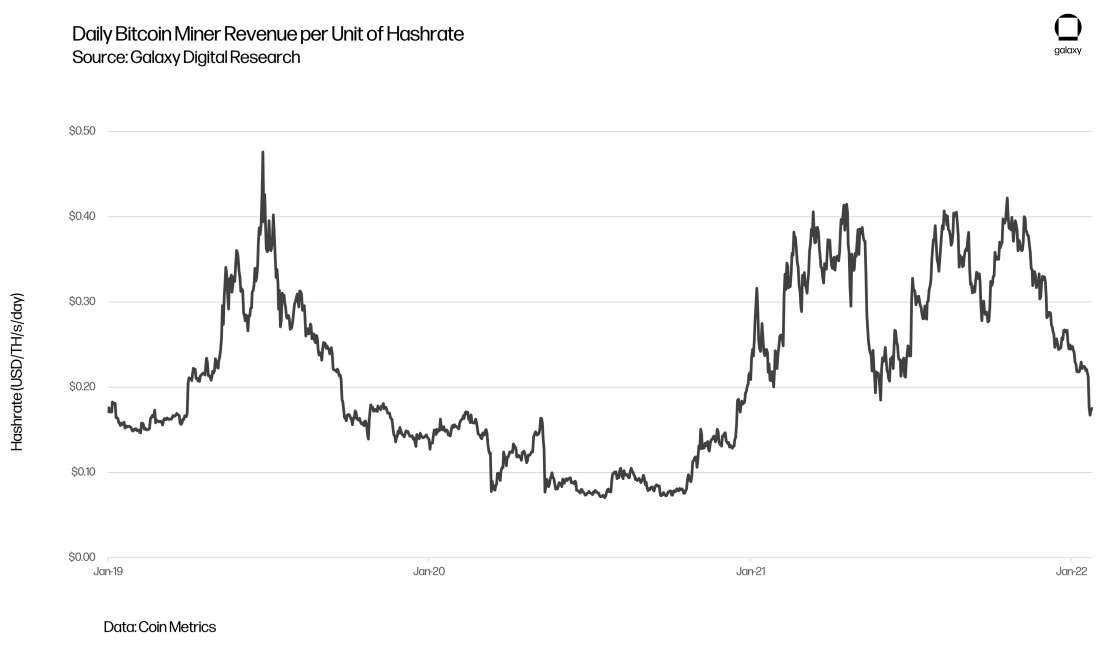
The costs associated with determining a miner’s breakeven hashprice are typically fixed for extended periods of time, with the exception of quality and availability of financing. Network hashprice, on the other hand, is both volatile and self-referential. Since 2019, network hashprice has ranged from 7¢ to 47¢, currently sitting around 18¢.

Network hashprice is ultimately dependent on issuance, fees, the price of bitcoin and hashrate. Since daily issuance is fixed within a halving period and fees are typically a small percentage of bitcoin-denominated revenue, the two most important variables are hashrate and price. The two variables are related: miners who are operating unprofitably will shut off their machines, bringing down network hashrate and correspondingly increasing bitcoin-denominated revenue for miners who remain online. As a result, after difficulty adjusts, network hashprice can sometimes react more slowly to declines in price than one would expect.
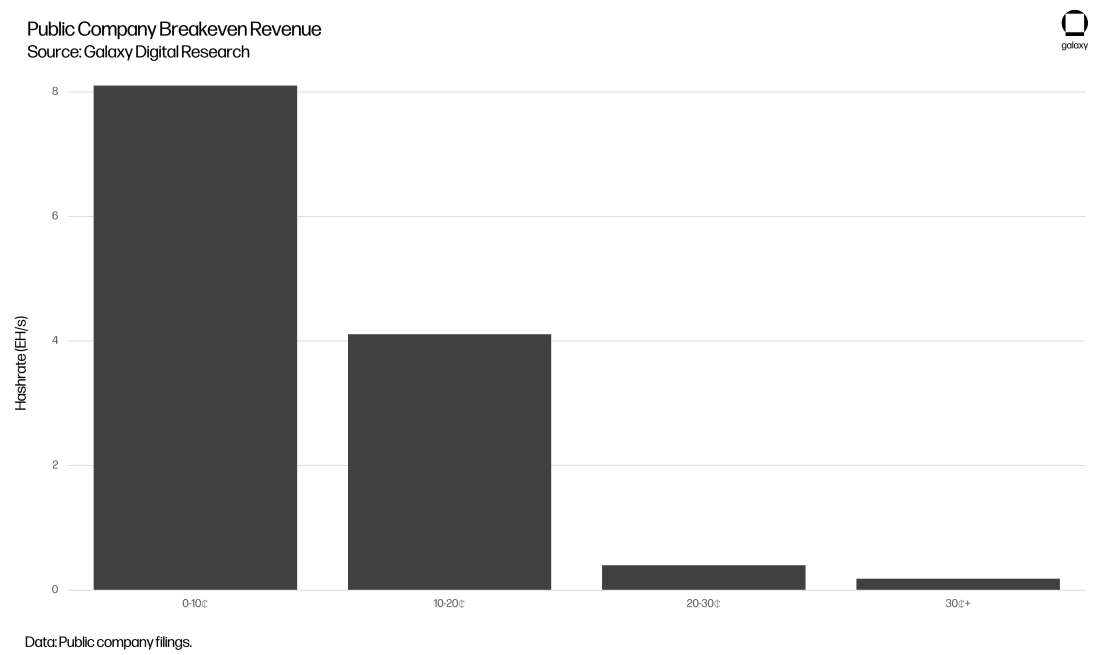
The 10 public companies we surveyed with filings available for Q3 2021 represented a total hashrate of 12.8 EH/s. Among these companies, breakeven hashprice ranged from 4¢ to 30¢, with a simple average of 13¢, a median of 11¢ and a hashrate-weighted average of 10¢. Larger miners typically operated more efficiently by this indicator than smaller ones, likely due to their ability to leverage economies of scale. The operational cost curve by hashrate derived from this methodology is shown below.

While this cost curve is unlikely to be representative of the total network cost curve, it does provide insight into one of the previously-inaccessible hidden variables in mining economics. Firms with a breakeven hashprice higher than the current network hashprice of 18¢ are mining unprofitably, and if current conditions continue may need to scale back operations or refinance. On the other side, miners at the very low end of the cost curve would have survived the troughs of the last bear market without substantive changes to their operations.
Caveats & Considerations
This methodology can be an effective way to understand a public miner's breakeven revenue, especially relative to peers; however, it’s not perfect. For companies with auxiliary sources of revenue like hosting, trading and lending, and selling equipment and carbon credits, their true breakeven hashprice can be more accurately calculated if segment operational costs are provided. However, the methodology outlined above whereby you subtract sources of revenue from operating costs can still serve as a great proxy for understanding the breakeven thresholds of the mining operation in isolation, and provides insight into the significance of the mining operation on the overall operational health of the company.
There’s also nuance and discretion in some expenses, chiefly payroll. For example, discretionary compensation during bull markets may differ from those during bear markets, and companies may operate leaner teams in more uncertain times.
Finally, our methodology excludes downtime, which can be a key variable in the profitability of an operation. One potential way to overcome the second limitation is to take the estimated hashrate from bitcoin mined rather than relying on reported hashrate, which would reflect a company’s average hashrate for the quarter net of downtime and deployment time. However, this estimate fails to differentiate between ongoing deployments and systematic downtime of already-deployed units, and ignores pool luck in cases where the miner operates their own pool. For these reasons, we prefer the more standardizable approach based on reported hashrate.
Conclusion
As mining continues to attract attention, new firms will enter the industry and more companies may seek a public listing. As this trend continues, and as the industry matures it will become more important to have a set of standardized tools and methodologies to evaluate and compare these companies’ operations. One such indicator, laid out above, is breakeven hashprice, which reflects a company’s robustness to drops in price and increases in hashrate.
Our approach is relatively straightforward, and allows analysts to derive a cost curve for a number of public miners, below which the core businesses of these companies operate unprofitably. We’ll continue to publish benchmarks based on this methodology, and believe it will become a more widely accepted comparative indicator.
Glossary
Bitcoin Mining Network Definitions
Network Hashprice - Network hashprice, often simply referred to as hashprice, is a measure of dollar-denominated daily expected revenue from mining with a single terahash per second of hashrate on a daily basis given current conditions around bitcoin price, block rewards and network hashrate.
Operational Breakeven Cost - Operational breakeven cost attempts to quantify all recurring expenditures that require a true cash outlay and includes cost of revenues, selling, general, and administrative (SG&A) expenses, and interest expenses, while excluding all non-cash expenses such as employee stock-based compensation and depreciation and amortization.
Network Hashrate - The network hashrate is the cumulative processing power of mining machines securing the network.
Hashprice - Hashprice measures expected daily mining revenue per terahash per second, in dollar terms.
Block Subsidy - The block subsidy is the amount of new bitcoin minted in each block. The block subsidy halves every 210,000 blocks (roughly every 4 years) according to Bitcoin’s issuance schedule and is currently 6.25 BTC.
Transaction Fees - Blocks can contain many transactions with fees attached to incentivize their confirmation and prevent spam. In addition to the block subsidy, miners also receive the transaction fees for all of the transactions included in the block that they mine.
Block Reward - The block reward is the combination of the block subsidy and all transaction fees paid by transactions in a specific block.
Hashrate - Hashrate is a measure of the computational power per second used when mining.
Power Draw - Power draw is a measure of the amount of electricity consumed to operate an ASIC or mining machine per hour.
Legal Disclosure:
This document, and the information contained herein, has been provided to you by Galaxy Digital Holdings LP and its affiliates (“Galaxy Digital”) solely for informational purposes. This document may not be reproduced or redistributed in whole or in part, in any format, without the express written approval of Galaxy Digital. Neither the information, nor any opinion contained in this document, constitutes an offer to buy or sell, or a solicitation of an offer to buy or sell, any advisory services, securities, futures, options or other financial instruments or to participate in any advisory services or trading strategy. Nothing contained in this document constitutes investment, legal or tax advice or is an endorsementof any of the digital assets or companies mentioned herein. You should make your own investigations and evaluations of the information herein. Any decisions based on information contained in this document are the sole responsibility of the reader. Certain statements in this document reflect Galaxy Digital’s views, estimates, opinions or predictions (which may be based on proprietary models and assumptions, including, in particular, Galaxy Digital’s views on the current and future market for certain digital assets), and there is no guarantee that these views, estimates, opinions or predictions are currently accurate or that they will be ultimately realized. To the extent these assumptions or models are not correct or circumstances change, the actual performance may vary substantially from, and be less than, the estimates included herein. None of Galaxy Digital nor any of its affiliates, shareholders, partners, members, directors, officers, management, employees or representatives makes any representation or warranty, express or implied, as to the accuracy or completeness of any of the information or any other information (whether communicated in written or oral form) transmitted or made available to you. Each of the aforementioned parties expressly disclaims any and all liability relating to or resulting from the use of this information. Certain information contained herein (including financial information) has been obtained from published and non-published sources. Such information has not been independently verified by Galaxy Digital and, Galaxy Digital, does not assume responsibility for the accuracy of such information. Affiliates of Galaxy Digital may have owned or may own investments in some of the digital assets and protocols discussed in this document. Except where otherwise indicated, the information in this document is based on matters as they exist as of the date of preparation and not as of any future date, and will not be updated or otherwise revised to reflect information that subsequently becomes available, or circumstances existing or changes occurring after the date hereof. This document provides links to other Websites that we think might be of interest to you. Please note that when you click on one of these links, you may be moving to a provider’s website that is not associated with Galaxy Digital. These linked sites and their providers are not controlled by us, and we are not responsible for the contents or the proper operation of any linked site. The inclusion of any link does not imply our endorsement or our adoption of the statements therein. We encourage you to read the terms of use and privacy statements of these linked sites as their policies may differ from ours. The foregoing does not constitute a “research report” as defined by FINRA Rule 2241 or a “debt research report” as defined by FINRA Rule 2242 and was not prepared by Galaxy Digital Partners LLC. For all inquiries, please email contact@galaxydigital.io. ©Copyright Galaxy Digital Holdings LP 2022. All rights reserved.


