End of Summer Shakeout

A large institutional seller sparks largest futures liquidations in both BTC and ETH since May 19, 2021. SOL led the way, BTC and ETH held up, while DeFi and altcoins underperformed.
Key Takeaways
A large BTC seller dumped on OTC markets into low liquidity during the US morning, causing price to break support
Price downturn spread to other spot markets including ETH and the rest of the altcoin market
Increased leverage in both BTC and ETH, but particularly ETH where futures open interest had reached ATH, sparked forced liquidations on futures platforms
The largest liquidations for BTC and ETH futures positions since May 19, 2021 quickly pushed prices down dramatically, with BTC down 17% and ETH down 27% peak-to-trough
Outside of liquidations, flows through Galaxy OTC skewed heavily to buy, with clients opting to buy the dip
While no clear news event to spark the selling, some observers pointed to 1) a buy-the-rumor-sell-the-news on El Salvador, 2) a delayed reaction to regulatory moves like the SEC’s announcement of an investigation into Uniswap Labs, 3) profit taking from hedge funds following a melt-up over the long weekend. Our view is that the move was mostly caused by selling and market structure rather than narrative
Bitcoin Selloff
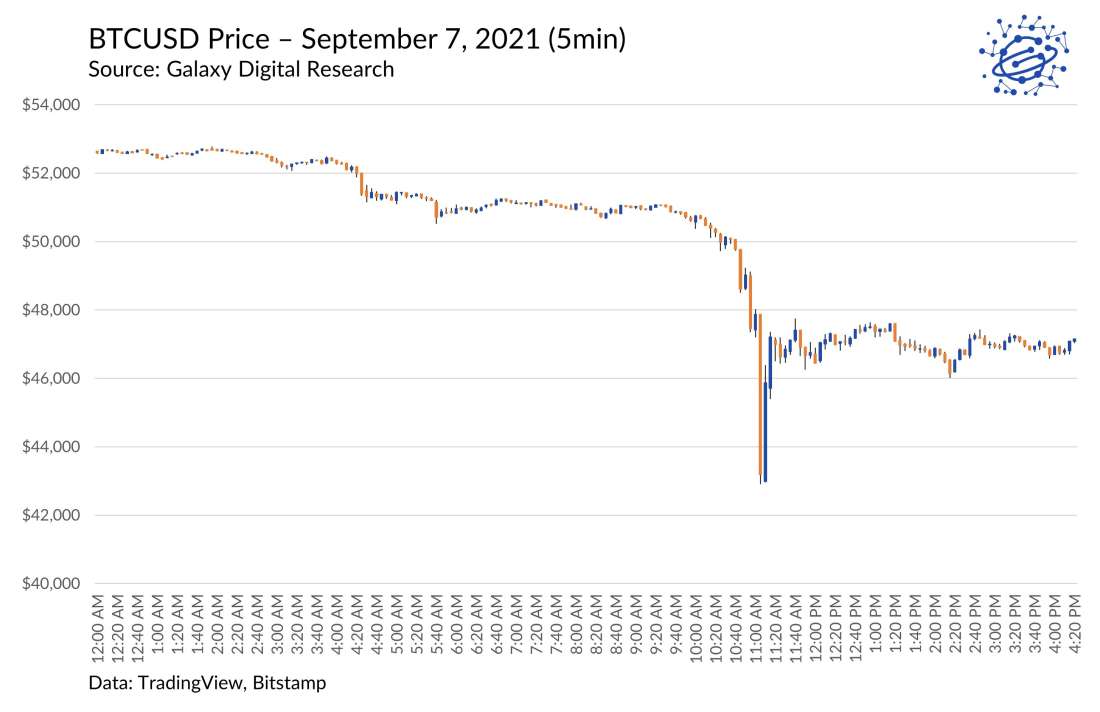
Amidst a broader dip in equities markets, bitcoin shed roughly $7,000 off its price, falling from around $50,000 to $43,000 in 30 minutes beginning around 10:40 AM EDT. The sell-off occurred as buying pressure cooled off with $53,000 acting as resistance. The drop began in spot markets and was exacerbated by futures markets, which saw their biggest liquidations for BTC and ETH futures since May 19, 2021. At its bottom, BTC was down 17% while ETH dropped 27%.
Other Coins Follow
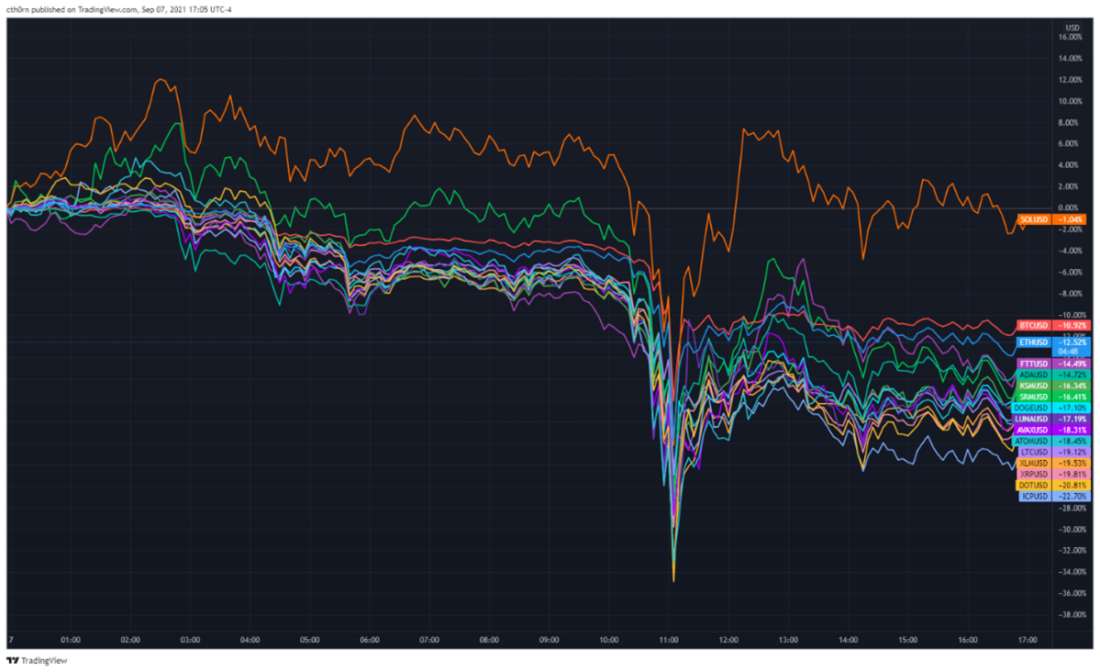
Altcoins and DeFi names followed BTC and ETH lower, with the FTX DeFi Index falling as much as 28% from peak-to-trough (in line with ETH’s drawdown), ultimately recovering to 16% lower at time of writing. Solana notably outperformed, dipping less and recovering faster than other coins and holding mostly flat on the day at the time of writing. After reaching all-time highs of $195.10 during the US morning, SOL slid to 170 during the “crash” and almost instantly recovered to 188, managing to close the day with a 4% gain. BTC and ETH held up as the next two best performing coins, with the rest of the market fairing worse.
Source: TradingView
Futures Markets & Liquidations
Open Interest
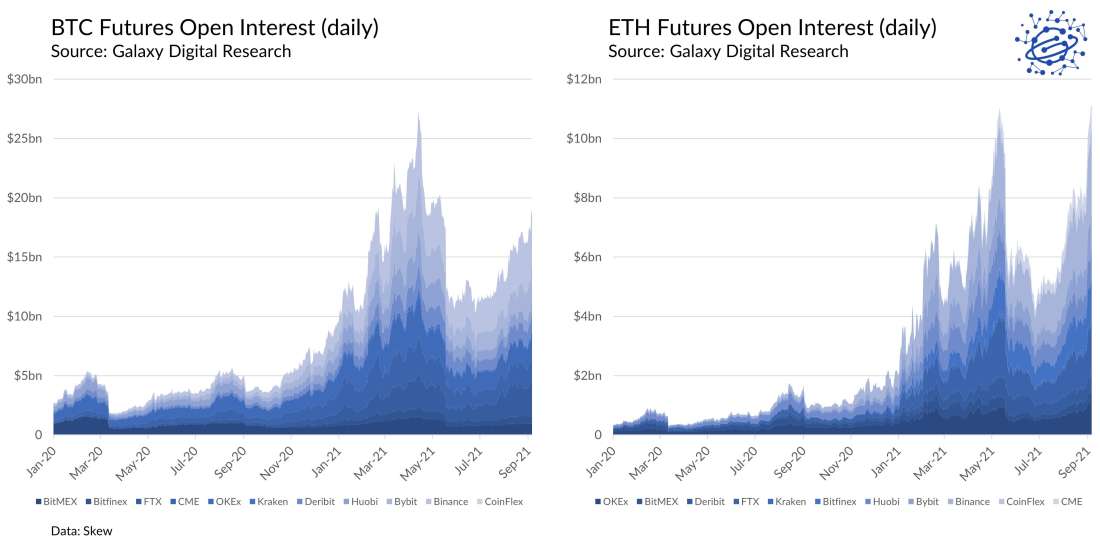
Just prior to the event, ETH futures open interest breached the May’21 highs, reaching an all-time-high of $11.1bn in open interest. Meanwhile, Bitcoin futures open interest had crept back up to levels not seen since May, though still remained well below its all-time high of more than $25bn.
Liquidations & Basis
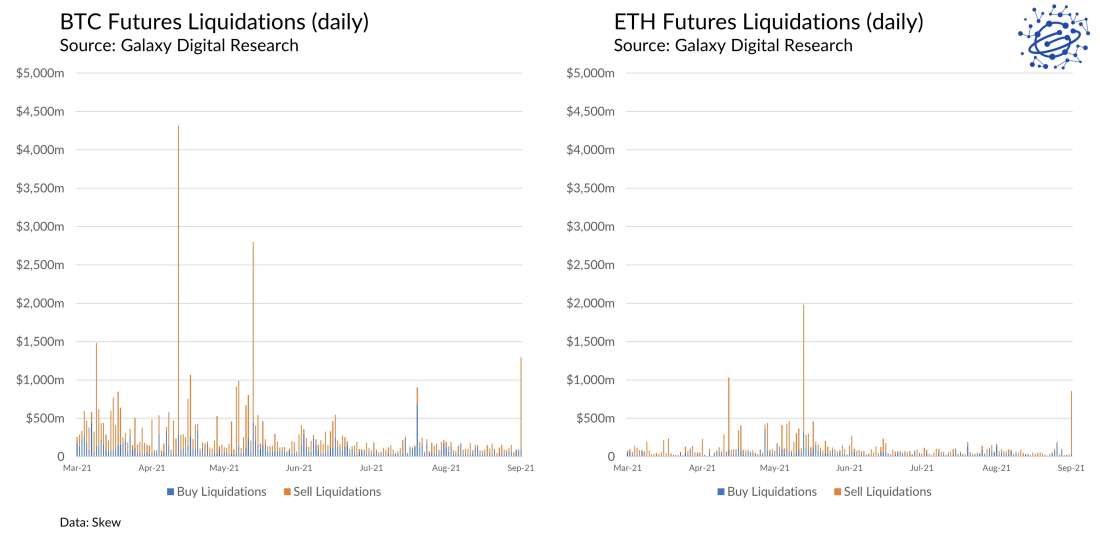
In turn, ETH saw $845mm in futures liquidations (8% of open interest) and the Deribit 1-month annualized spot-futures knee jerked from 10% to as high as 28% just before the move lower, dipping to -2% as spot sold off and ultimately settling at 12% as of writing. BTC basis did not experience the sharp initial jump seen by ETH, rather it traded sideways around 10% prior to dipping to -25% and quickly reversing to 10%. Of the $19bn in BTC futures OI moving into the event, $1bn were liquidated (5% of OI).
Liquidations as % of Spot Volume
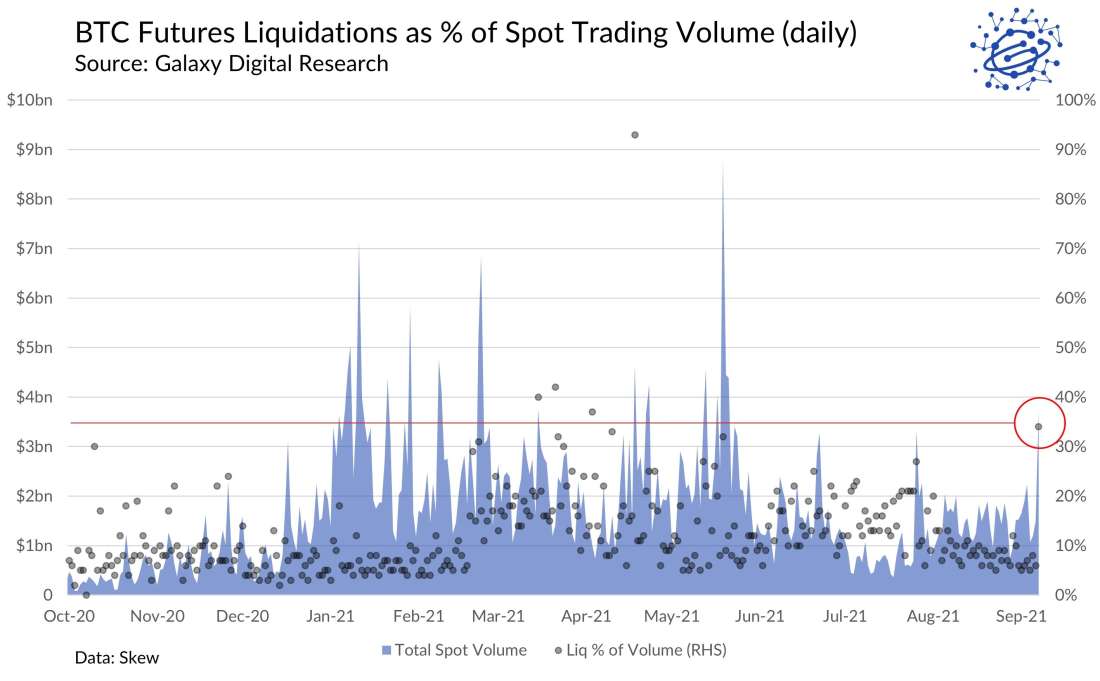
In addition to both BTC and ETH seeing the largest day of liquidations since May 19, 2021 in absolute terms, it’s worth noting that low spot volumes added to the carnage. One way to visualize this is to compare liquidations to the total traded spot volume. On Tuesday, BTC liquidations were 34% of total traded spot volume across major exchanges (vs. the 1y daily average of 12%), the largest since April 18 (when liquidations were more than 90% of traded spot volume, a day of extreme volatility and an outlier in the dataset).
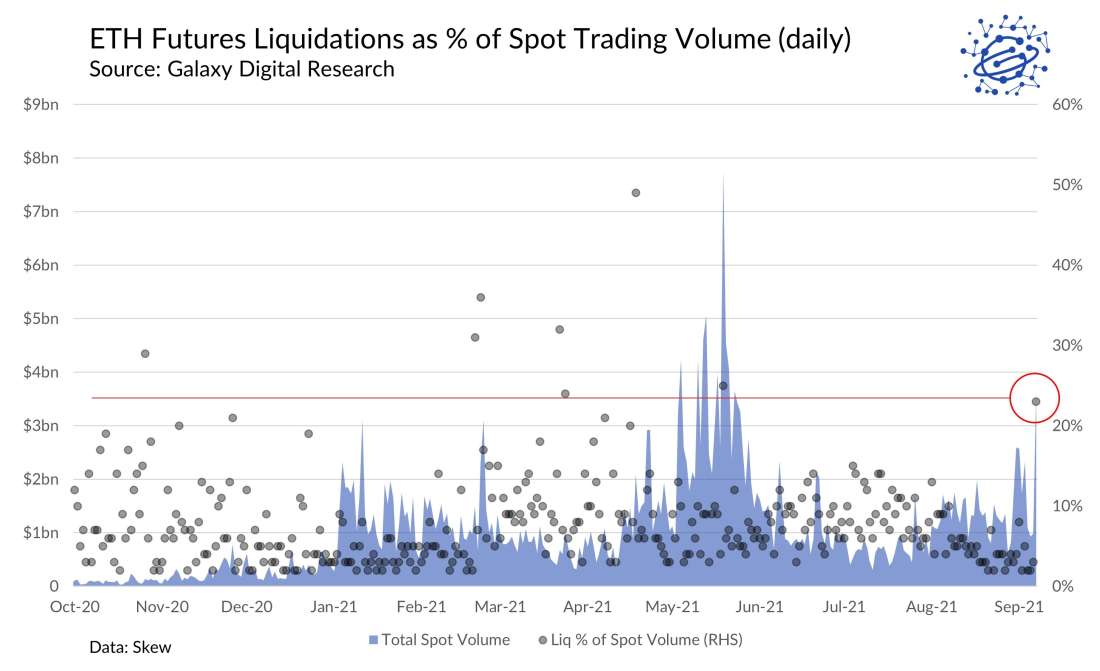
ETH liquidations were 23% of total traded spot volume across major exchanges (vs. the 1y daily average of 8%).
Outlook
Ultimately, both BTC and ETH were in overbought territory after enjoying significant appreciation over the summer. With BTC holding above its 200-day moving average and ETH holding well above $3000, we view the near-term technical structure as unchanged and our outlook positive, particularly with institutional inflows expected to resume now that summer has ended.
Legal Disclosure:
This document, and the information contained herein, has been provided to you by Galaxy Digital Holdings LP and its affiliates (“Galaxy Digital”) solely for informational purposes. This document may not be reproduced or redistributed in whole or in part, in any format, without the express written approval of Galaxy Digital. Neither the information, nor any opinion contained in this document, constitutes an offer to buy or sell, or a solicitation of an offer to buy or sell, any advisory services, securities, futures, options or other financial instruments or to participate in any advisory services or trading strategy. Nothing contained in this document constitutes investment, legal or tax advice or is an endorsement of any of the stablecoins mentioned herein. You should make your own investigations and evaluations of the information herein. Any decisions based on information contained in this document are the sole responsibility of the reader. Certain statements in this document reflect Galaxy Digital’s views, estimates, opinions or predictions (which may be based on proprietary models and assumptions, including, in particular, Galaxy Digital’s views on the current and future market for certain digital assets), and there is no guarantee that these views, estimates, opinions or predictions are currently accurate or that they will be ultimately realized. To the extent these assumptions or models are not correct or circumstances change, the actual performance may vary substantially from, and be less than, the estimates included herein. None of Galaxy Digital nor any of its affiliates, shareholders, partners, members, directors, officers, management, employees or representatives makes any representation or warranty, express or implied, as to the accuracy or completeness of any of the information or any other information (whether communicated in written or oral form) transmitted or made available to you. Each of the aforementioned parties expressly disclaims any and all liability relating to or resulting from the use of this information. Certain information contained herein (including financial information) has been obtained from published and non-published sources. Such information has not been independently verified by Galaxy Digital and, Galaxy Digital, does not assume responsibility for the accuracy of such information. Affiliates of Galaxy Digital may have owned or may own investments in some of the digital assets and protocols discussed in this document. Except where otherwise indicated, the information in this document is based on matters as they exist as of the date of preparation and not as of any future date, and will not be updated or otherwise revised to reflect information that subsequently becomes available, or circumstances existing or changes occurring after the date hereof. This document provides links to other Websites that we think might be of interest to you. Please note that when you click on one of these links, you may be moving to a provider’s website that is not associated with Galaxy Digital. These linked sites and their providers are not controlled by us, and we are not responsible for the contents or the proper operation of any linked site. The inclusion of any link does not imply our endorsement or our adoption of the statements therein. We encourage you to read the terms of use and privacy statements of these linked sites as their policies may differ from ours. The foregoing does not constitute a “research report” as defined by FINRA Rule 2241 or a “debt research report” as defined by FINRA Rule 2242 and was not prepared by Galaxy Digital Partners LLC. For all inquiries, please email [email protected]. ©Copyright Galaxy Digital Holdings LP 2022. All rights reserved.


