NFT Marketplace Update

While NFT activity is slowly recovering from crypto winter lows, it remains far below the levels of activity witnessed in 2021 and 2022. The price of ETH has outperformed blue chip NFT projects in 2023 Q1, which have seen their floor prices decline in ETH terms. A longstanding positive correlation between ETH price and NFT activity is breaking down. The narratives that have driven ETH’s success in 2023, such as staking and the maturation of layer 2 networks, do not predominantly involve NFTs. As a result, the NFT market is contracting, reaching new yearly lows for trade count and transaction volume. However, across a range of metrics the NFT market today remains significantly above the 12-month lows seen in Nov 2022. This note will provide a comprehensive overview on the state of the NFT market and uncover new narratives to follow.
Key Takeaways
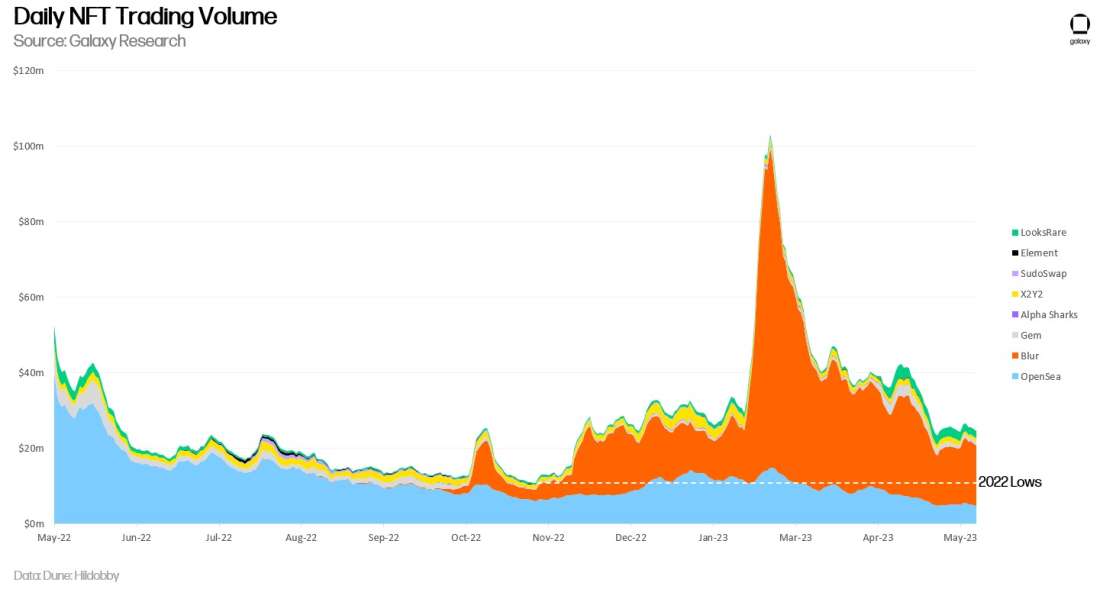
Daily trading volume on NFT marketplaces hit a YTD high of $130m in late February, but has declined since then, with daily averages declining each month (March $70m, April $35m, and May $30m).
A large portion of NFT trading activity in 2023 has been inorganic and influenced by Blur’s airdrops.
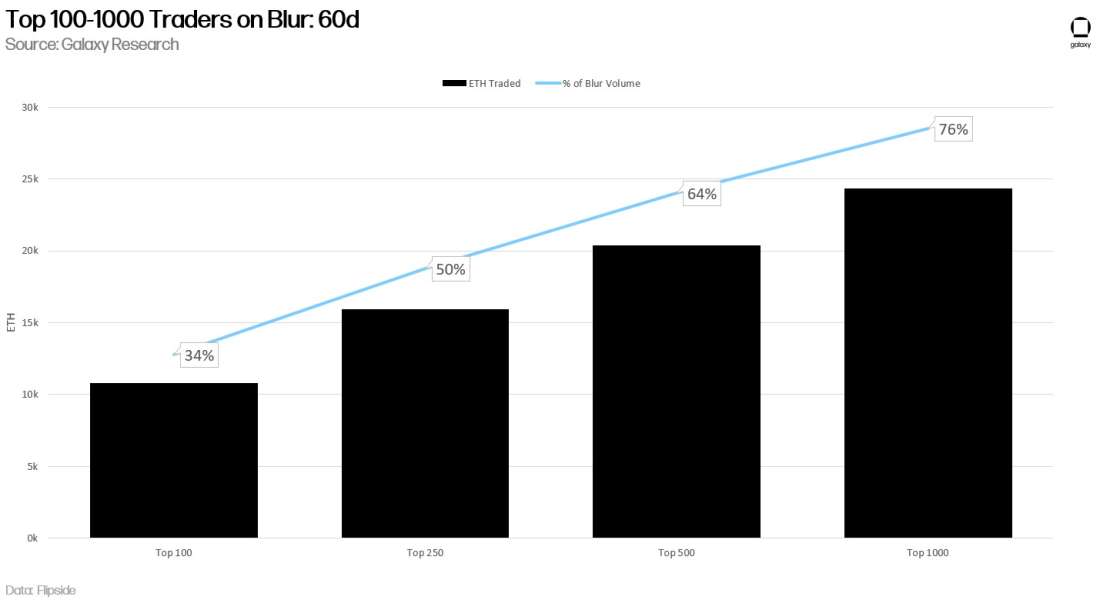
The top 1% of Blur traders account for 64% of the platform’s volume.
Blur’s dominance in NFT trading volume will remain through the season 2 airdrop.
NFT royalties are becoming less relevant in the bear market.
Blur vs. OpenSea
The NFT marketplace showdown between Blur and OpenSea has been the most followed event in the NFT ecosystem this year. After the Blur token airdrop on Feb. 14, Blur trading volume dominance reached an all-time high of 80% market share, with OpenSea’s trading volume market share diminishing to 15.5%. This activity was largely due to airdrop framers positioning themselves for Blur’s season 2 token airdrop.
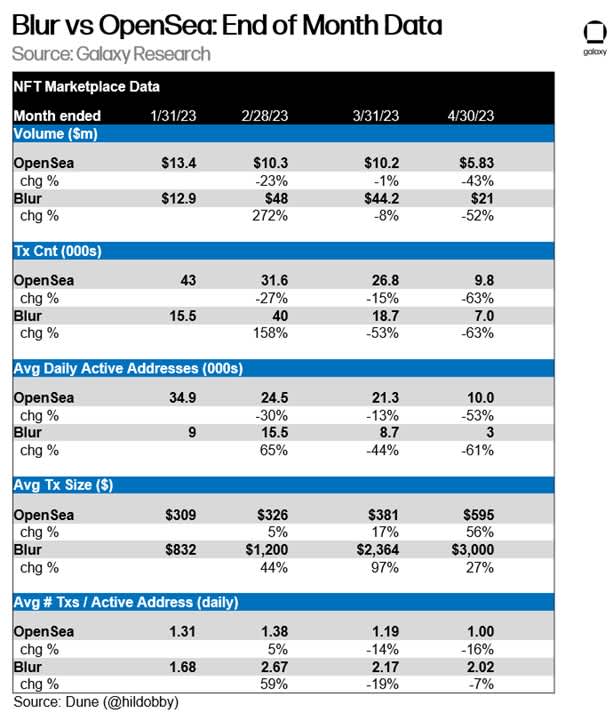
Blur’s user base skews more to professional NFT traders while OpenSea has strong capture on the retail market, but OpenSea has worked to court trading volume back to its platform. Since Blur launched, OpenSea’s share of NFT trading volume is down 75%. With retail NFT collectors much less active in the bear market, OpenSea has begun taking steps to court the professional NFT trading cohort that comprises Blur’s active user base. OpenSea volumes increased when they removed their 2.5% marketplace fee and lowered the mandatory creator royalty fee to 0.5% on Feb. 17—in 5 weeks OpenSea’s trading volume increased from 15.5% to 23.7% (+52%) while Blur’s decreased 15%. Around the same time, OpenSea also launched a “pro” trading platform, a UX tailored for professional traders that mimics many of Blur’s most popular features.
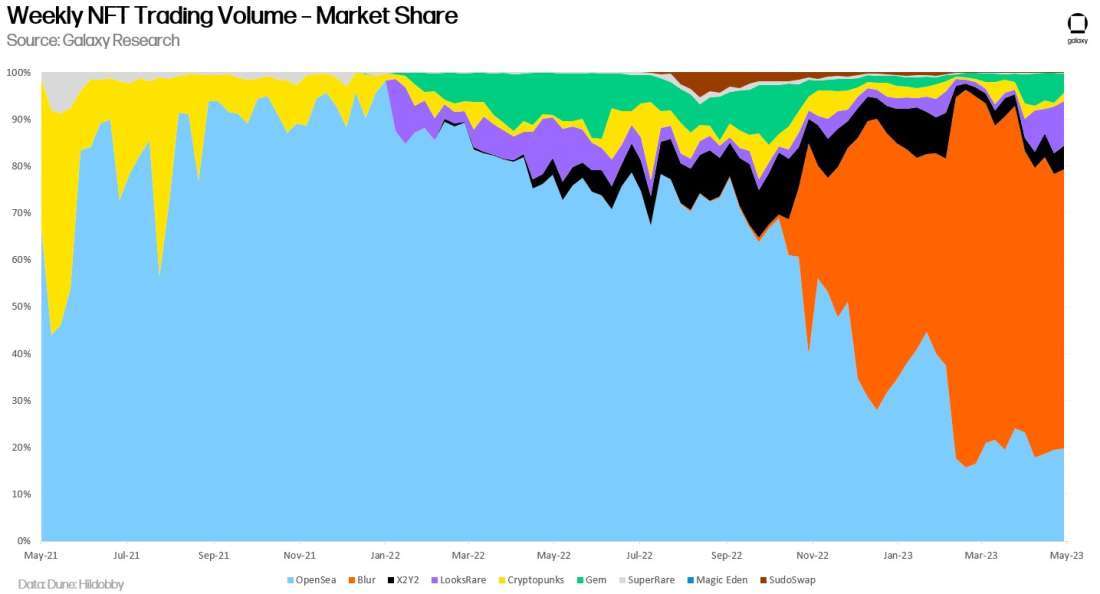
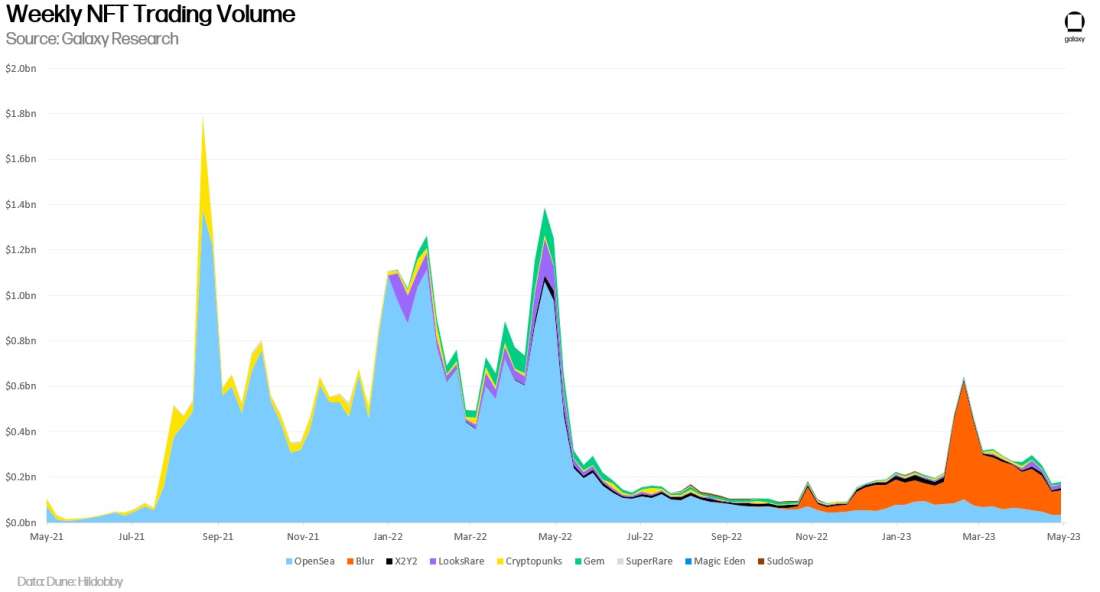
Blur saw its largest inflow of trading volume from Feb 20 – Mar 6, pushing its NFT trading volume dominance to a record 80%. To date, this is the highest percentage of market share trading volume Blur achieved. Although OpenSea’s platform became more profitable from their new optional royalty model, Blur’s season 2 airdrop outweighed OpenSea’s initiatives.
Whale Hunting Blur Traders
On Blur, the top 1% of traders are responsible for approximately 64% of the platform’s trading volume, whereas on OpenSea, the top 1% of traders contribute a mere 20% of trading volume.
Below we mapped out the user concentration among the top 100 – 1000 Blur traders over the past 60 days. From the data, it’s clear that a minority share of Blur users account for a large sum of the platform’s trading volume. The evident user concentration on Blur points to the case that the platform is a hub for ETH whales who execute high-value transactions and purchase larger quantities of items.
Daily ERC-721 Token Transfers
Most NFTs on Ethereum use the ERC-721 token standard, while most fungible tokens use the ERC-20 standard. Throughout the prior bull market, activity involving ERC-20 tokens declined while non-fungible token transfers increased, a sign of the growing influence of NFTs on the blockchain. ERC-721 token transfers peaked in Spring 2022, which was the “market top” for NFTs. Since then, the trend has reversed, with ERC-20 token activity dramatically outpacing NFTs. The substantial difference in ERC-20 and ERC-721 token transfers is influenced by the rapid decline in weekly NFT trades coupled with NFT collectors becoming inactive. Additionally, the recent surge in meme coins, which function as ERC-20 tokens, could potentially be contributing to the decline in ERC-721 transfers.
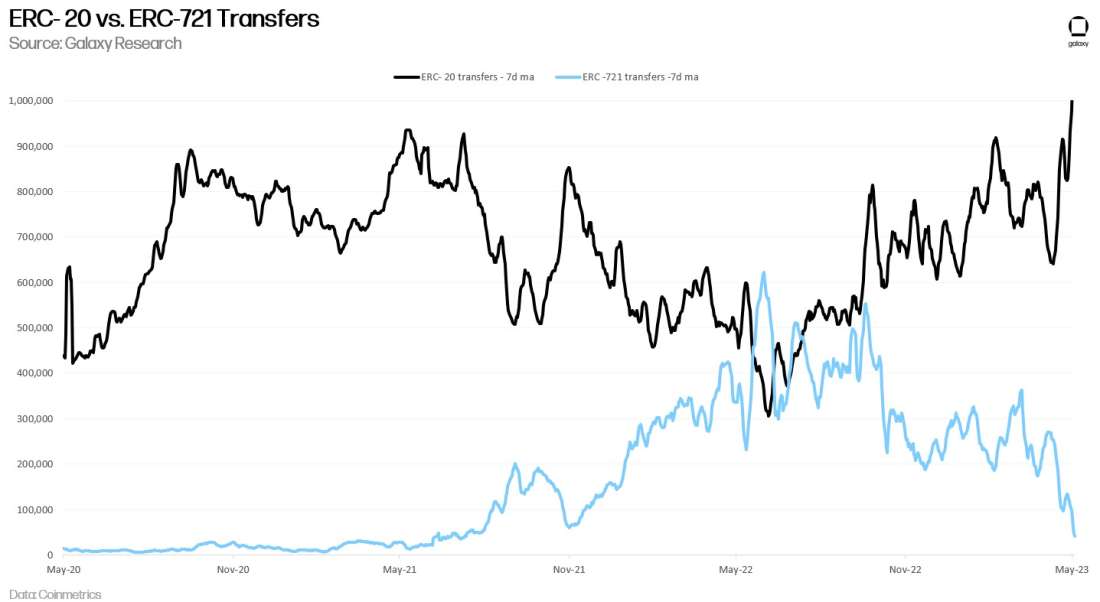
Here we can see declining weekly trades and traders moving in line with decreasing ERC-721 transfers.
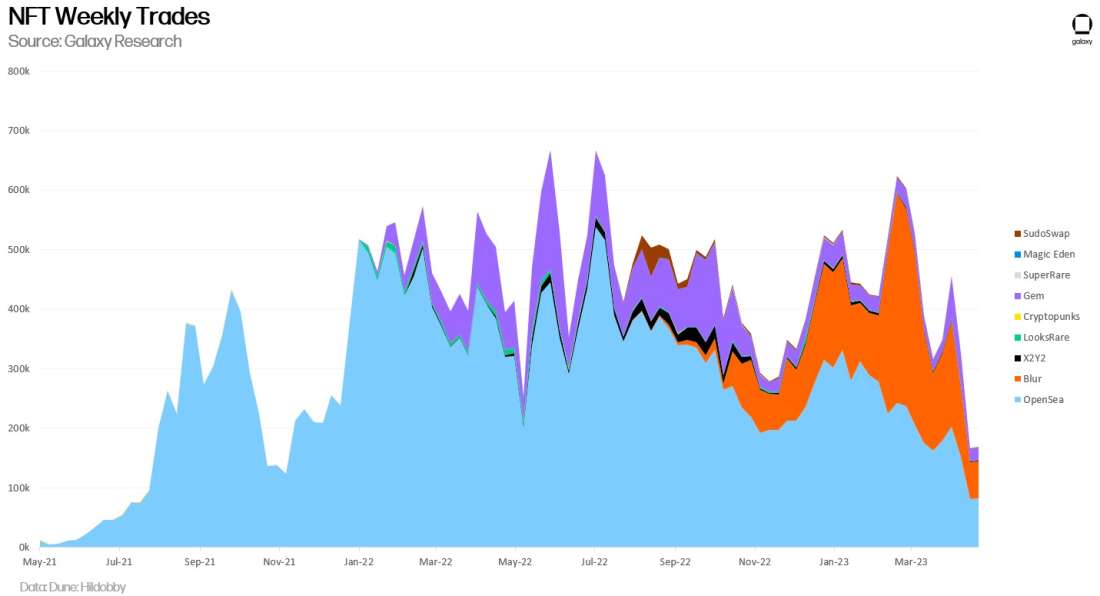
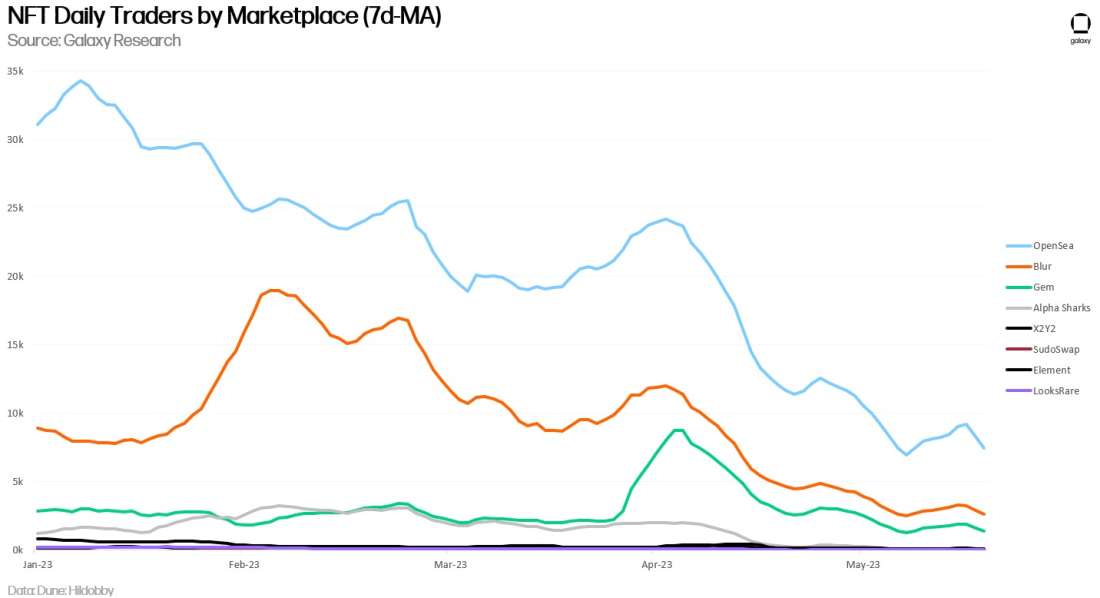
Trading Activity Sustains
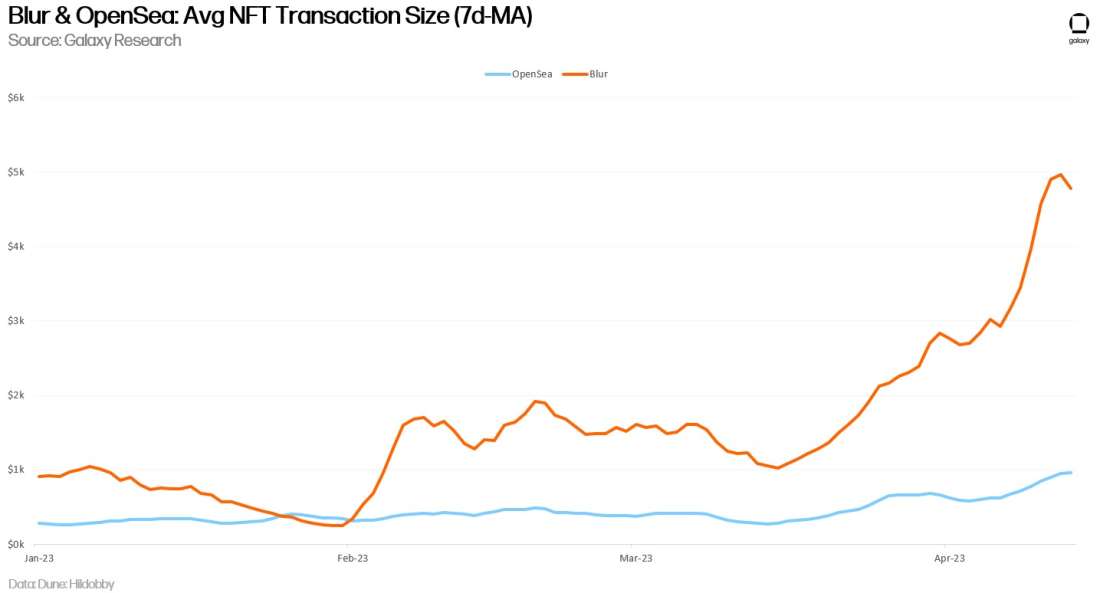
Although weekly NFT trades and the number of NFT traders is declining, the average transaction size for NFT trades is increasing. LooksRare and Sudoswap had the largest increases in average trade size, while Blur and OpenSea witnessed a steady increase. Increases in average trade size highlight that NFT buyers are deploying more capital into the space as they see opportunistic entry points with low floor prices.
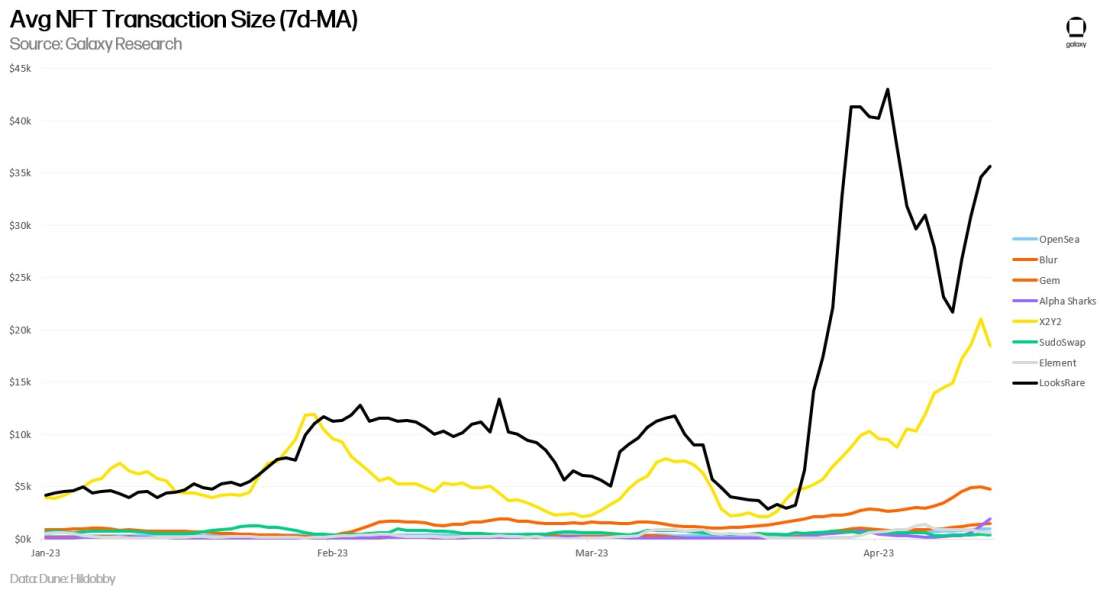
Most importantly, NFT activity today is up 3x above the 12-month daily volume lows seen in Nov 2022. This is significant when considering that there were more active NFT traders in Nov 2022 than May 2023. While NFT activity remains below their peaks, trading volumes may see tailwinds from renewed interest from sidelined NFT traders, new product offerings, and competitive practices between marketplaces.
Blue Chips
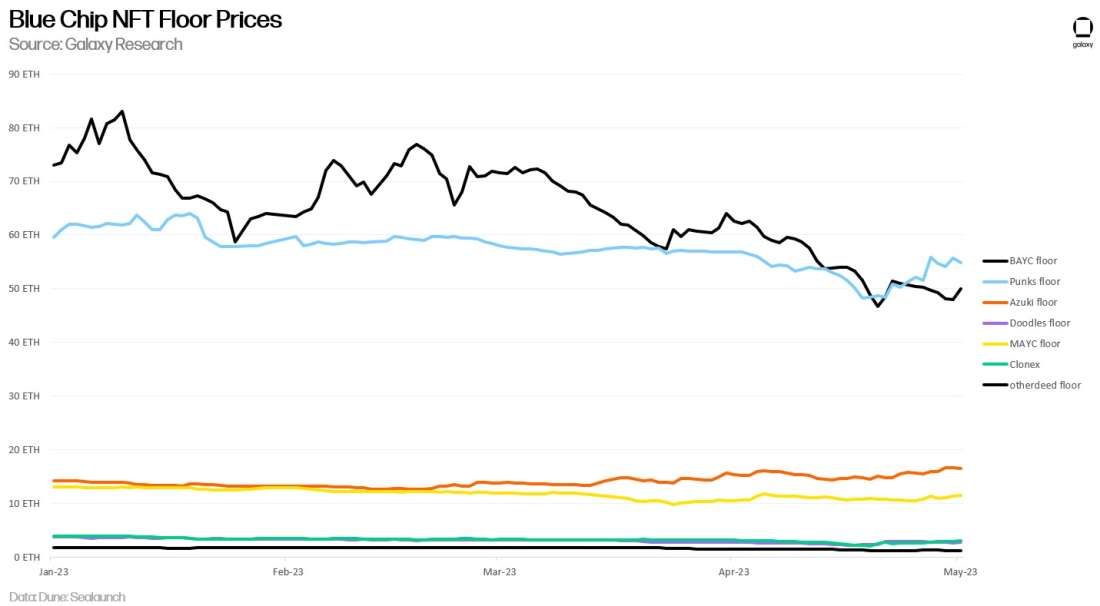
Observing the activity of top NFT collections gives insight into the current market sentiment. Historically, whenever floor prices for blue chip projects decline, the overall NFT market is contracting. Since January 2023, floor prices for top tier NFT projects are trending downwards. This trend is fueled by blue chip NFT collectors de-risking their exposure to the contracting NFT market by cutting losses.
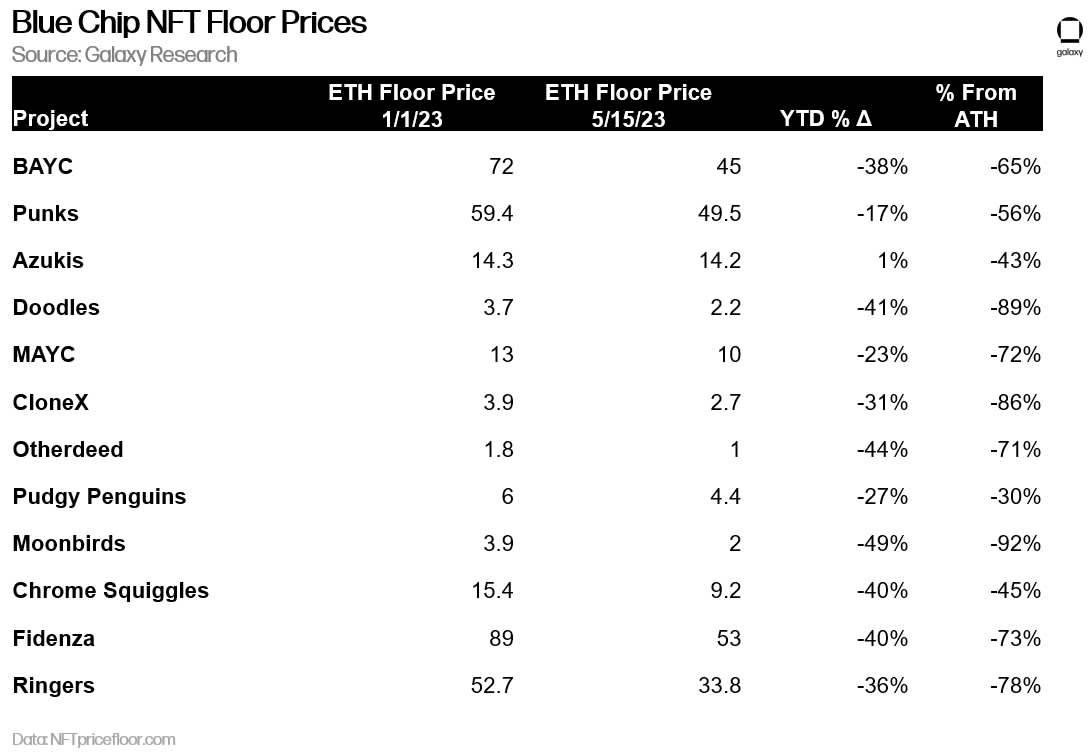
The overall decline in floor prices for blue chip NFT projects is pulling collections further away from their all-time highs.
Royalties
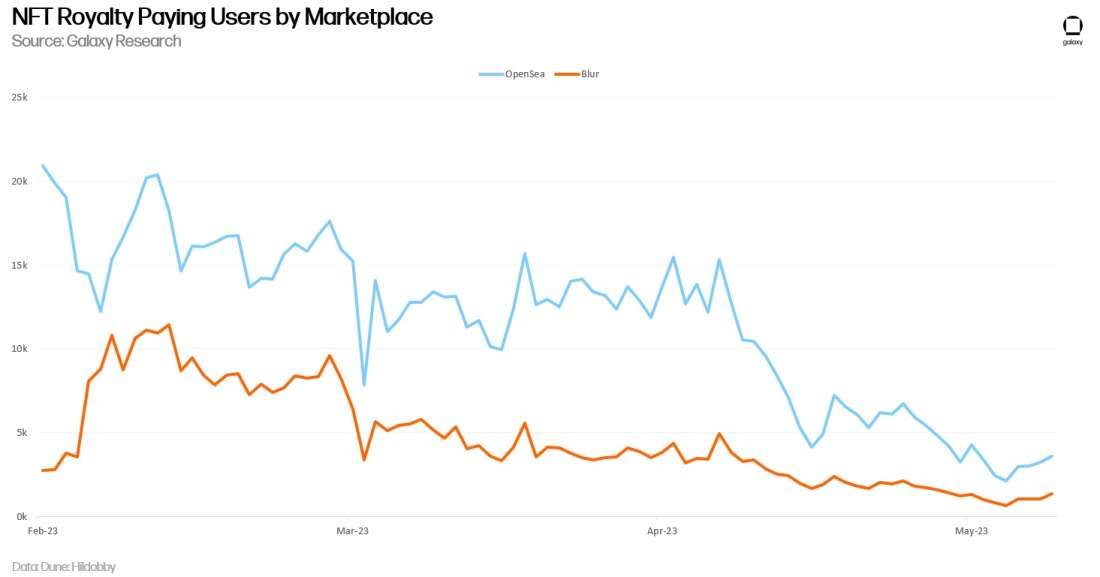
Royalty fee paying transactions continue to nosedive for all major NFT marketplaces. From OpenSea and Blur’s YTD highs, both platforms witnessed a 90% reduction in royalty-paying transactions. OpenSea’s decision to enforce 0.5% for royalties instead of their typical 5.0%-7.5% is the key factor behind the marketplace’s abrupt absence of royalty paying users. Although OpenSea’s userbase is beginning to dishonor creator royalties, the marketplace accounts for 63% of NFT royalty paying transactions (Blur’s share is 37%). With the two largest marketplaces now operating in a royalty-optional model, it’s clear that creators will need to develop new structures or strategies to earn income from NFTs. In our NFT royalty report, we predicted that the overwhelming control that NFT marketplaces have over royalties will be the key determinant to whether royalties exist long-term.
Outlook
NFT trading volume is down significantly but may be bottoming out. It’s clear that Blur is dominating on volumes, but OpenSea continues to dominate on users. Ultimately, OpenSea’s user base is more organic and perhaps durable in the long term, while Blur’s is almost exclusively high time preference whales. The introduction of Blur’s new lending product (Blend) is already altering market dynamics, reaffirming their volume dominance but also helping to push floor prices up as traders and users can purchase expensive NFTs with smaller amounts of capital.
Despite floor price declines even for the most popular NFT collections, blue chip NFTs have nonetheless remained quite resilient in the bear market, which strongly suggests that the NFT market is “down, but not out.” Excitement about Ordinals, NFTs built on Bitcoin, is also driving new interest in the space, and it’s likely that both Blur and OpenSea will add support for them. Signals to follow for the return of NFTs include ERC-721 vs. ERC-20 transfers and OpenSea retail trading volume—until a major rebound, it’s a game for pros, and the two largest marketplaces are catering to them.
Legal Disclosure:
This document, and the information contained herein, has been provided to you by Galaxy Digital Holdings LP and its affiliates (“Galaxy Digital”) solely for informational purposes. This document may not be reproduced or redistributed in whole or in part, in any format, without the express written approval of Galaxy Digital. Neither the information, nor any opinion contained in this document, constitutes an offer to buy or sell, or a solicitation of an offer to buy or sell, any advisory services, securities, futures, options or other financial instruments or to participate in any advisory services or trading strategy. Nothing contained in this document constitutes investment, legal or tax advice or is an endorsementof any of the digital assets or companies mentioned herein. You should make your own investigations and evaluations of the information herein. Any decisions based on information contained in this document are the sole responsibility of the reader. Certain statements in this document reflect Galaxy Digital’s views, estimates, opinions or predictions (which may be based on proprietary models and assumptions, including, in particular, Galaxy Digital’s views on the current and future market for certain digital assets), and there is no guarantee that these views, estimates, opinions or predictions are currently accurate or that they will be ultimately realized. To the extent these assumptions or models are not correct or circumstances change, the actual performance may vary substantially from, and be less than, the estimates included herein. None of Galaxy Digital nor any of its affiliates, shareholders, partners, members, directors, officers, management, employees or representatives makes any representation or warranty, express or implied, as to the accuracy or completeness of any of the information or any other information (whether communicated in written or oral form) transmitted or made available to you. Each of the aforementioned parties expressly disclaims any and all liability relating to or resulting from the use of this information. Certain information contained herein (including financial information) has been obtained from published and non-published sources. Such information has not been independently verified by Galaxy Digital and, Galaxy Digital, does not assume responsibility for the accuracy of such information. Affiliates of Galaxy Digital may have owned or may own investments in some of the digital assets and protocols discussed in this document. Except where otherwise indicated, the information in this document is based on matters as they exist as of the date of preparation and not as of any future date, and will not be updated or otherwise revised to reflect information that subsequently becomes available, or circumstances existing or changes occurring after the date hereof. This document provides links to other Websites that we think might be of interest to you. Please note that when you click on one of these links, you may be moving to a provider’s website that is not associated with Galaxy Digital. These linked sites and their providers are not controlled by us, and we are not responsible for the contents or the proper operation of any linked site. The inclusion of any link does not imply our endorsement or our adoption of the statements therein. We encourage you to read the terms of use and privacy statements of these linked sites as their policies may differ from ours. The foregoing does not constitute a “research report” as defined by FINRA Rule 2241 or a “debt research report” as defined by FINRA Rule 2242 and was not prepared by Galaxy Digital Partners LLC. For all inquiries, please email [email protected]. ©Copyright Galaxy Digital Holdings LP 2023. All rights reserved.


