Why are Bitcoin Transaction Fees So Low?
Bitcoin transaction fees are near all-time lows, despite significant user activity and price volatility. This curious Bitcoin phenomenon is a result of growing adoption of Bitcoin scaling technologies and best practices.
Key Takeaways
Bitcoin transaction fees are at all-time lows by some measurements, despite significant price volatility. Persistent low fees are the result of efficient block space usage, rather than a decline in economic use of the Bitcoin network.
Several significant efficiency gains occurred in June 2021 that are contributing to reduced fees, including: a notable increase in adoption of Segregated Witness, a jump in the proportion of batched transactions, and a spike in usage of the Lightning Network. Growing adoption of these technologies appears to have led to network-wide efficiency gains.
Changes in user behavior that contributed to reduced block space demand also occurred in June 2021, including a sharp decline in Tether and other OP_RETURN transactions on the Bitcoin network, and reduced miner selling.
While fees will not always remain this low, the success of scaling Bitcoin via transaction compression and efficiency gains rather than block space expansion is a major achievement for developers allied with the “small blocker” faction in The Block Size Wars.
The Most Confounding Chart in Bitcoin
By most measures, Bitcoin transaction fees (BTC) are at or near all-time lows. Fees tend to spike during periods of rapid price appreciation, with increased speculation generating growing competition for block space. Every major bullish period since 2012 has resulted in a corresponding increase in fees, with one major exception: the Fall 2021 bull run, where BTC rose to an all-time high around $69,00, but fees instead remained at all-time lows.
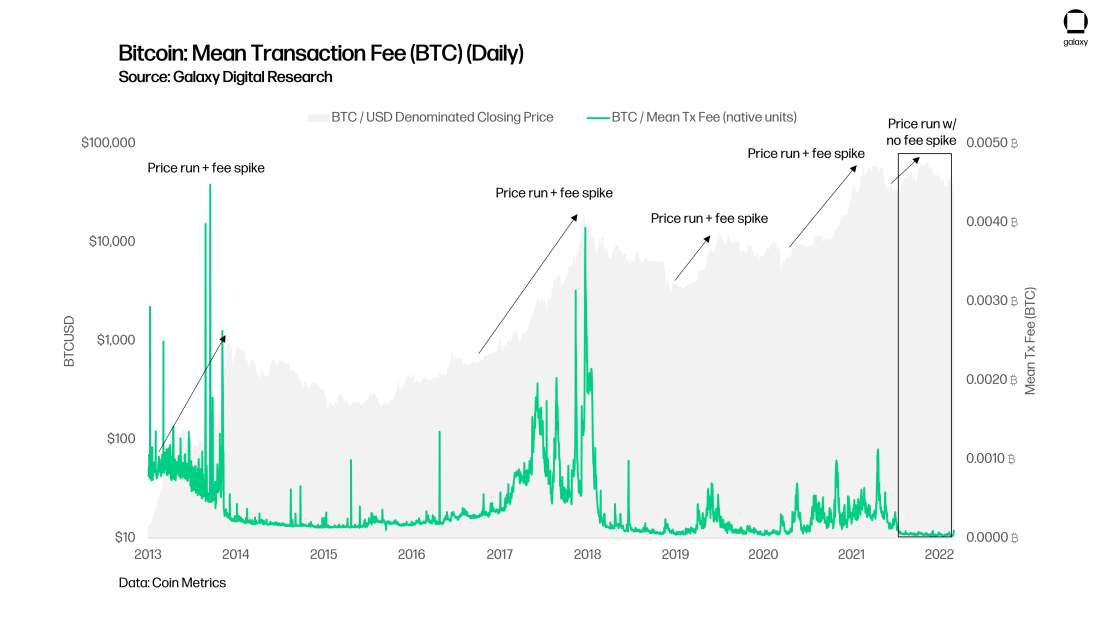
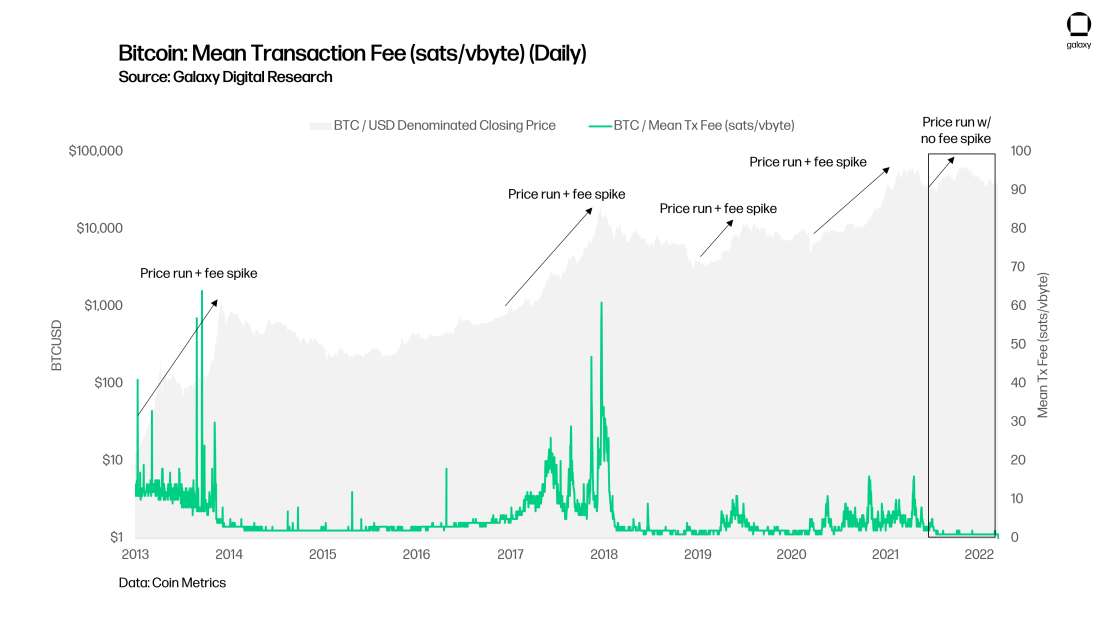
There are many ways to visualize Bitcoin transaction fees, but they all show fees at or near all-time lows. The chart above shows the mean total BTC paid in fees per transaction on a daily basis (i.e., the sum of all TX fees paid in a day divided by the daily transaction count). Because Bitcoin transaction fees are paid based on the weight of a transaction (in data size), many think of the fee market denominated by bitcoin per byte, or more accurately, satoshis (sats) per virtual byte. We will discuss the different between bytes and virtual bytes in a subsequent section.
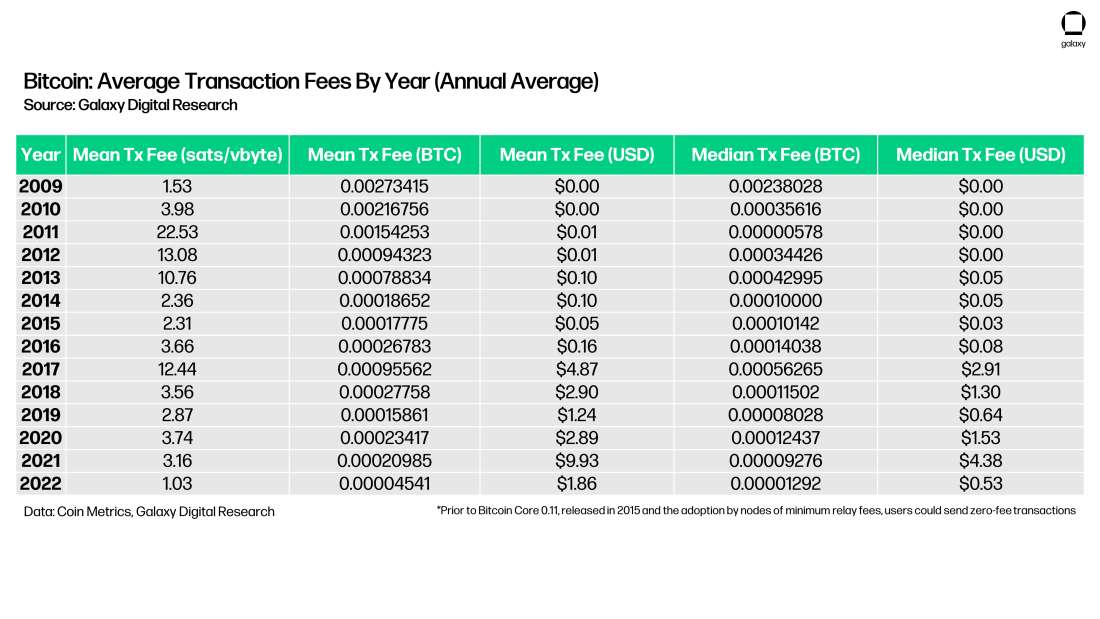
When looking at fees in dollar terms, the last 9 months hasn’t seen the lowest of all time, but it’s still close. (Prior occasions with dollar-denominated fees this low occurred when the BTCUSD exchange rate was significantly lower than in 2022).
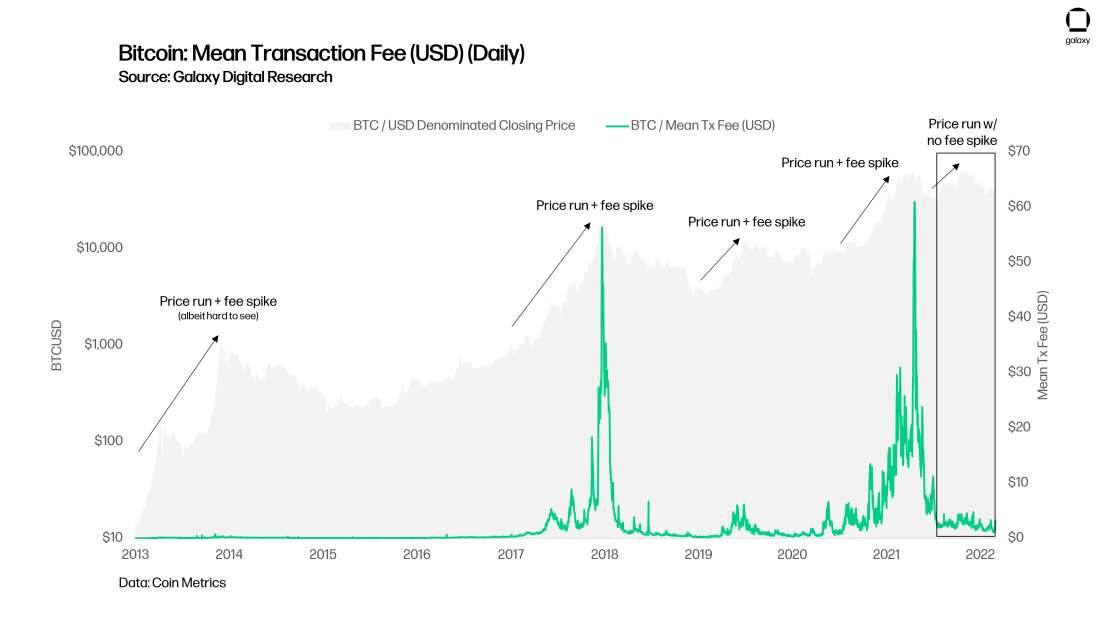
The mean transaction fee paid to send a bitcoin transaction in 2022 is 0.00004541 ₿ (the lowest ever), while the median is 0.00001292 ₿ (the lowest of any year except 2011). (It’s important to note that a minimum transaction relay fee was added in Bitcoin Core 0.11 (July 2015) to help control spam, a consideration when evaluating median and mean transaction fees prior to 2015). When measured by satoshis per virtual byte (“sats/vbyte”), 2022 is also the lowest ever at just a median of just over 1 sat/vbyte. In USD terms, 2022 isn’t the cheapest fee market ever ($1.86 mean and $0.53 median), but the mean is the lowest since 2019 (when BTCUSD traded as low as 10% of today’s price) and the median is the lowest since 2016.
Transaction Fee Auction Background
In times of high demand for block space—when there are many pending transactions—users may use the transaction fee to compete for miner attention and block inclusion, participating in a first-price auction, also known as a pay-as-bid mechanism. Miners decide which transactions to include in their blocks and spenders include a fee with their transactions to incentivize miners to publish their transactions to the blockchain more quickly. When the spender’s transaction makes it into a block, the miner collects the included fee as reward (along with any block subsidy, i.e., newly-minted bitcoin). This mechanism allows high-time preference spenders to outbid low-time preference spenders in times of network congestion, ensuring that the most economically important transactions get confirmed first. When pending transaction congestion persists, markets adjust and lead
Bitcoin Block Space
Given that competition for transaction confirmation is the key driver for Bitcoin user behavior on fees, the level of block space usage is a key indicator for fee markets. Blocks filled up in 2017 when bitcoin ran to $20k, in 2019 when bitcoin ran to $13k, and throughout 2020 and 1H 2021 as bitcoin ran to all-time highs. But blocks haven’t been full since June 2021 following the crash to $29k after China’s “final” ban on bitcoin trading and mining, and fees subsequently collapsed to their lowest levels ever. Even when bitcoin pushed to new all-time highs in Fall 2021 (reaching $69k), blocks did not fill and fees did not rise. (Note, while blocks were not typically full prior to 2017, some users still paid higher fees in BTC terms either to guarantee immediate inclusion, due to the lack of quality fee estimation tools, or simply because prices were so low that fees were still non-existent in dollar terms).
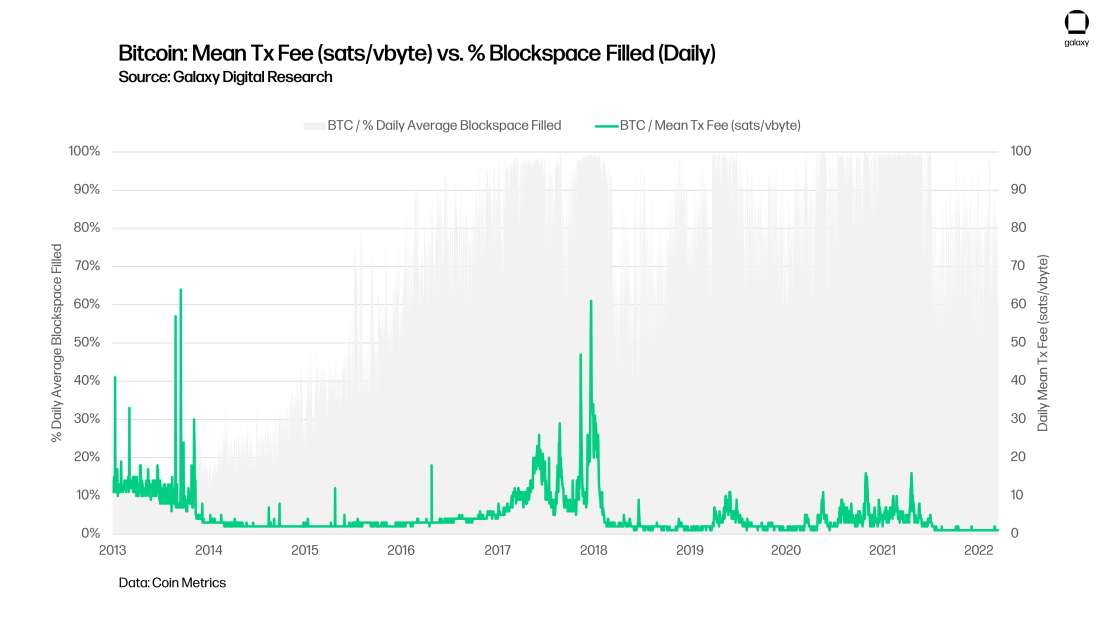
In the modern Bitcoin era, the last 9 months are the only time that a BTCUSD all-time high has not resulted in full blocks. When blocks are full and transaction demand is high, fees will rise. When blocks aren’t full and demand is high, fees may still rise, but they won’t rise dramatically. And when blocks aren’t full and demand is low, fees will plummet.
Scaling Bitcoin with Segregated Witness
A major factor contributing to the decline in block space usage is growing adoption of segregated witness (SegWit) transactions. Segregated Witness is an upgrade enacted on Bitcoin in August 2017 via soft fork (BIP-148) which solved an important transaction malleability issue but also changed how a transaction’s data usage is calculated. Specifically, SegWit segregates signature (witness) data by moving it to the end of the transaction, replaces the concept of bytes (data size) with virtual bytes (“weight”), and finally recalculates the weight of signature data such that each byte of it counts only as ¼ of a weight unit. This change effectively allows block sizes to increase to around 4mb if all transactions are SegWit transactions and, thus, can be thought of as an effective block size increase. However, the size of Bitcoin blocks in terms of bytes can only scale above the 1mb threshold based on the amount of SegWit transactions, and it is because of SegWit’s enactment on August 24, 2017 that block sizes in bytes are seen to begin creeping above the 1mb limit (the black line in the chart below). You can also see the mean block weight (the SegWit calculation, blue line below) hitting its max size (full blocks) at 4,000,000 weight units. Bitcoin developer and educator Jimmy Song provides an excellent overview of SegWit’s impact on block size here.
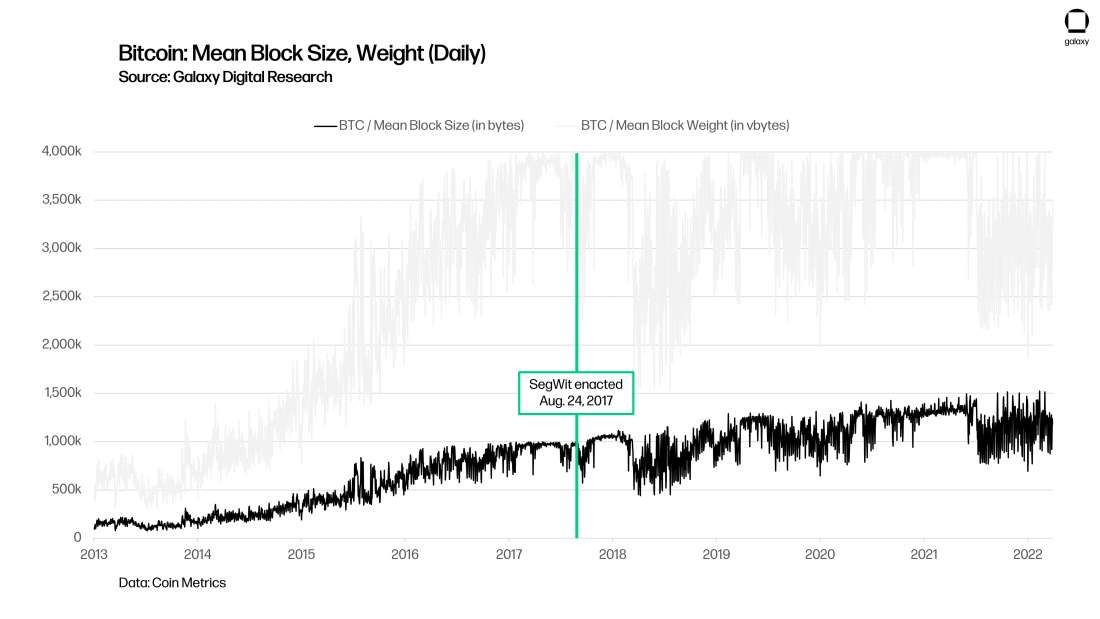
When looking at the mean block weight above, we can see that blocks cease to be full on average around June 2021. One major reason for this is SegWit adoption. On June 1, 2021, the % of transactions utilizing SegWit (and therefore making use of this more efficient weight calculation) was 53%. But by July 1, the portion had risen over 70%. Blockchain.com, perhaps the single largest provider of Bitcoin wallets, finally integrated SegWit into its platform on March 31, 2021. The jump in SegWit adoption in June 2021 visible below coincides with the decline in full block and beginning of today’s low-fee environment.
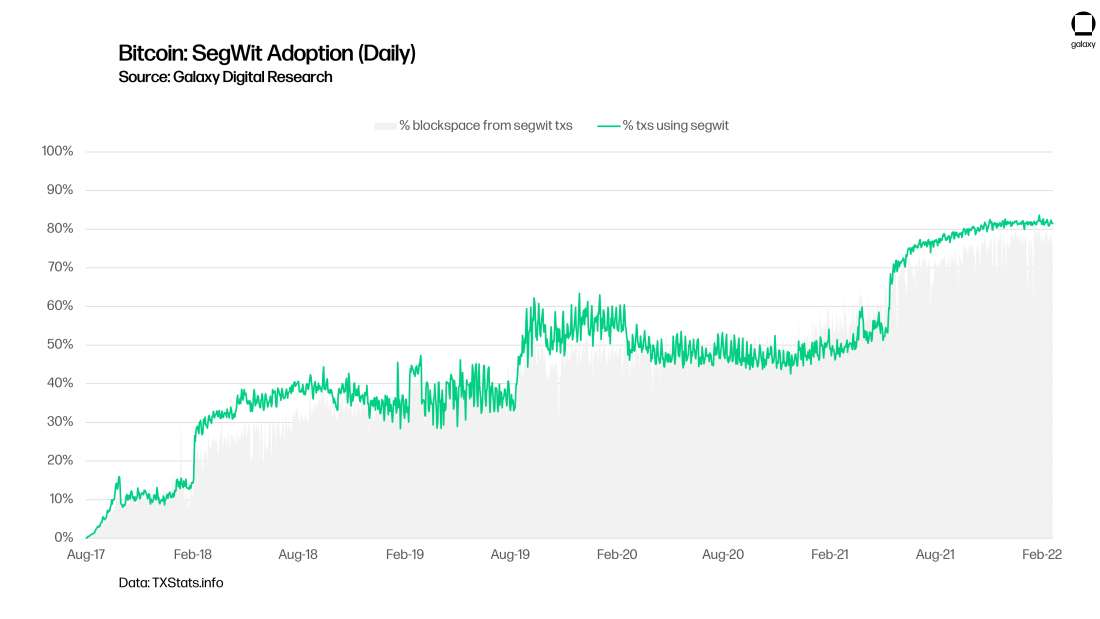
The growth of SegWit adoption to more than 80% of all transactions took nearly 5 years from August 2017 activation. This major upgrade to Bitcoin was the result of several years of battling between “small blockers” and “big blockers” known as The Block Size Wars. The small blockers believed in scaling Bitcoin by using the protocol more efficiently, while the big blockers sought to expand the block size to make room for more transactions. It took nearly 5 years, but SegWit is now widely adopted, and it’s helping Bitcoin scale.
Scaling Bitcoin with Transaction Batching
Bitcoin users can also realize significant efficiency gains by batching multiple spends into one transaction. For example, an exchange can process many client withdrawals in one on-chain transaction by spending many outputs to many clients within the same transaction, rather than sending a separate transaction for every withdrawal. This practice, known as transaction batching, can realize significant space saving, increase the ratio of economic activity to transaction count, and dramatically reduce the fees per individual withdrawal. The more outputs included in a transaction, the lower the realized fee per output and, therefore, the greater the efficiency.
As explained by the Bitcoin experts at Bitcoin Optech, adding just 4 more receiving entities to a typical bitcoin transaction with one input can save the spender more than 60% in fees per output (payment). You can examine other scenarios and compare the savings using Bitcoin Optech’s transaction size calculator.

Image Source: Scaling Bitcoin Using Payment Batching, Bitcoin Optech (Mar. 26, 2021)
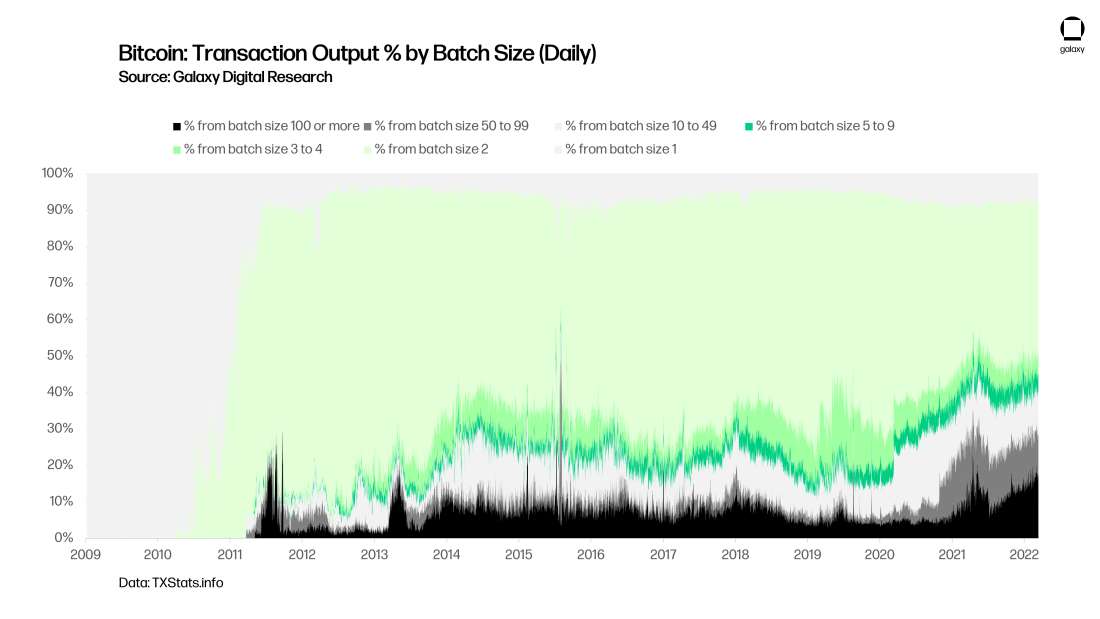
We can see that a large increase in the percent of daily outputs spent as part of larger batches occurred at the beginning of the current low-fee environment in May 2021. Specifically, the portion of outputs that were included as part of batches of 100 outputs or more rose to its highest ever level at more than 23% in late May 2021. The percentage of outputs belonging to transactions with more than 3 outputs, the lowest threshold we consider to be a batch transaction, reached 53%, the highest level ever, and has remained elevated at around 50%. The elevated usage of transaction batching significantly reduces the per-payment block space requirement and reduces fee pressure across the network.
Transaction Count
Daily transaction counts have declined consistently since 2019, when Bitcoin briefly processed as many as 500k transactions per day. The chart below shows both the daily percentage of block space filled as well as transaction counts, stacked by OP_RETURN and non-OP_RETURN transaction types.
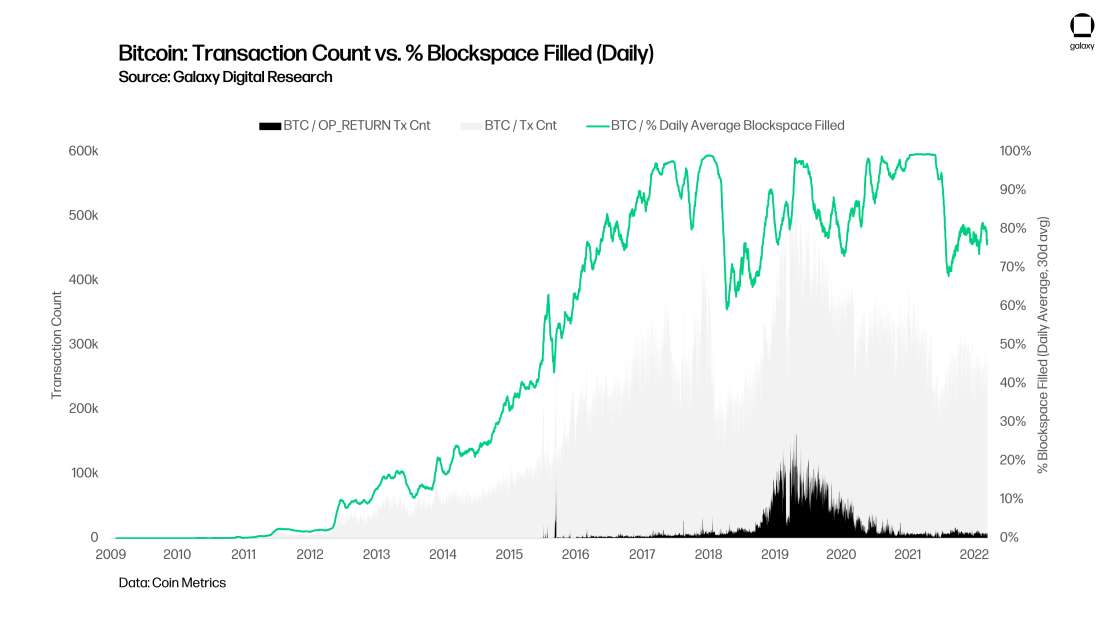
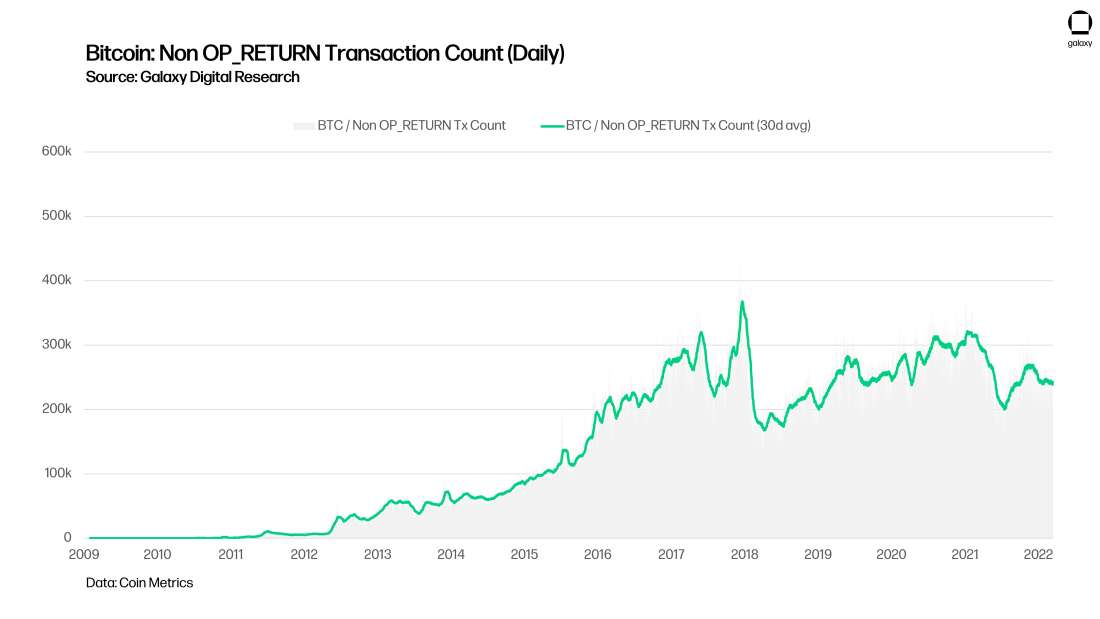
But the decline in transaction counts since the 2019 peaks should be taken with a grain of salt. OP_RETURN transactions, those that utilize Bitcoin to store arbitrary data rather than to move funds, spiked in after 2018 following the launch of VeriBlock, a separate proof-of-proof network that stored records of its own blocks as arbitrary data on Bitcoin’s blockchain in an attempt to anchor the security of its own blockchain to Bitcoin. When OP_RETURN transactions are removed, we can see a much more consistent transaction count over time. Indeed, as of March 2022, the 30d average of transaction count is only slightly below 2019-2021 levels.
In addition to the decline of VeriBlock, another major user of OP_RETURN transactions has mostly left the Bitcoin network: Tether. Although Tether moved mostly off Bitcoin’s Omni Network several years prior, the last vestiges of USDT on BTC mostly vanished at the end of May 2021, also coinciding with the beginning of the current low-fee environment.
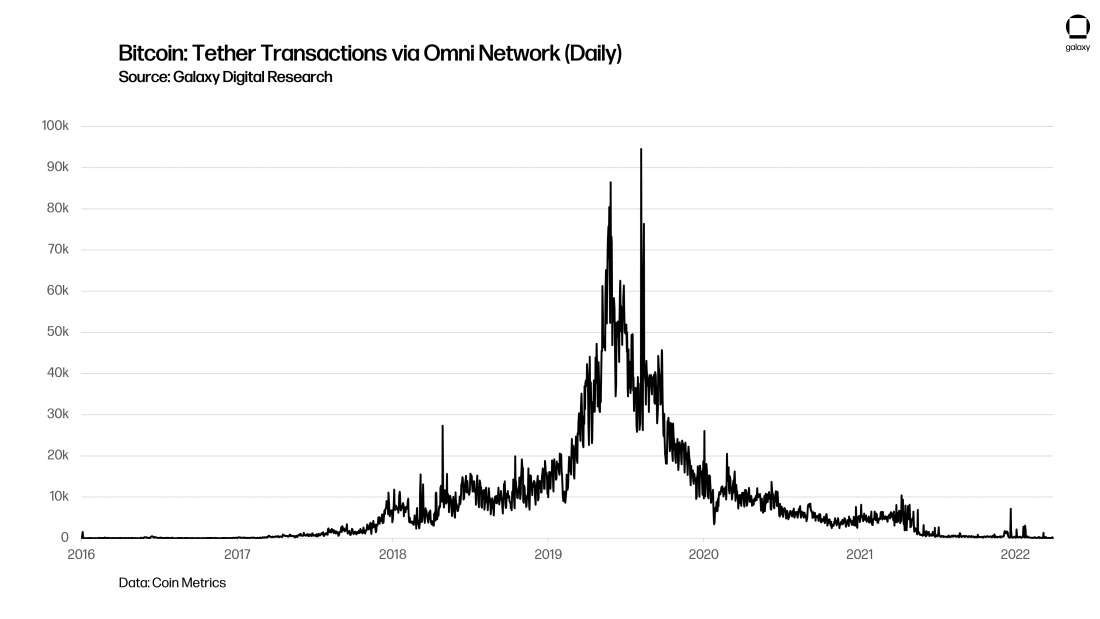
We can conclude, therefore, that demand for transactions driven by non-arbitrary data—i.e., on-chain economic transactions—remains relatively consistent. Furthermore, the decline in OP_RETURN transactions occurred well before the “all-time high but no fee spike” phenomenon of Fall 2021.
Reduced Miner Selling
As China enacted a sweeping ban on Bitcoin mining and trading in May and June 2021, miners were seen turning off their machines, resulting in significant hashrate declines. With no hashrate online, these miners ceased earning new mining rewards, and thus were unable to sell coins they were not earning. The chart below shows the daily count (30d average) of BTC sent from addresses believed to belong to individual mining operations. Coin Metrics uses a clever heuristic to identify miners themselves, as opposed to mining pools: rather than count the flows out of addresses that receive coinbase transactions (the transactions that miners include at the top of a mined block to pay themselves the rewards, not the cryptocurrency exchange), Coin Metrics assumes those addresses belong to pools and instead tracks the behavior of the secondary addresses to whom those coins are sent. The metric below then tracks the sum total sent on a daily basis from those addresses which are ”1 hop” from coinbase transactions, assumed to be mining operations themselves. We can assume that sends from these 1 hop addresses are typically indicative of miner selling behavior. The chart below indicates a significant decline in selling behavior in May 2021, and since then miner selling has been hovering at or below historically low levels. In our view, the fact that selling behavior has remained muted even as hashrate has rebounded is partially due to the migration of miners to North America and the rise of publicly traded mining companies, which increasingly finance their operations by raising debt and equity capital rather than selling their coins. For more information on this topic, read our report 2021: Bitcoin Mining’s Big Year.
Notably, the data above counts the coins that leave from 1 hop miner addresses, rather than the number of transactions these entities submit to the network. For the purposes of this report, the latter would be preferred to show declining transactional activity from miners as an impact on block space, but we were unable to procure that data in time to publish this report. Nonetheless, miners earn a predictable reward based on hashrate and those who sell often do so on a regular cadence, so the sum of BTC sold is likely proportional to the amount of transactions sent. Therefore, we view this as a sufficient proxy to argue that miner transaction has also declined, and that the start of the decline coincided with the start of the current low-fee environment.
Growing Lightning Adoption
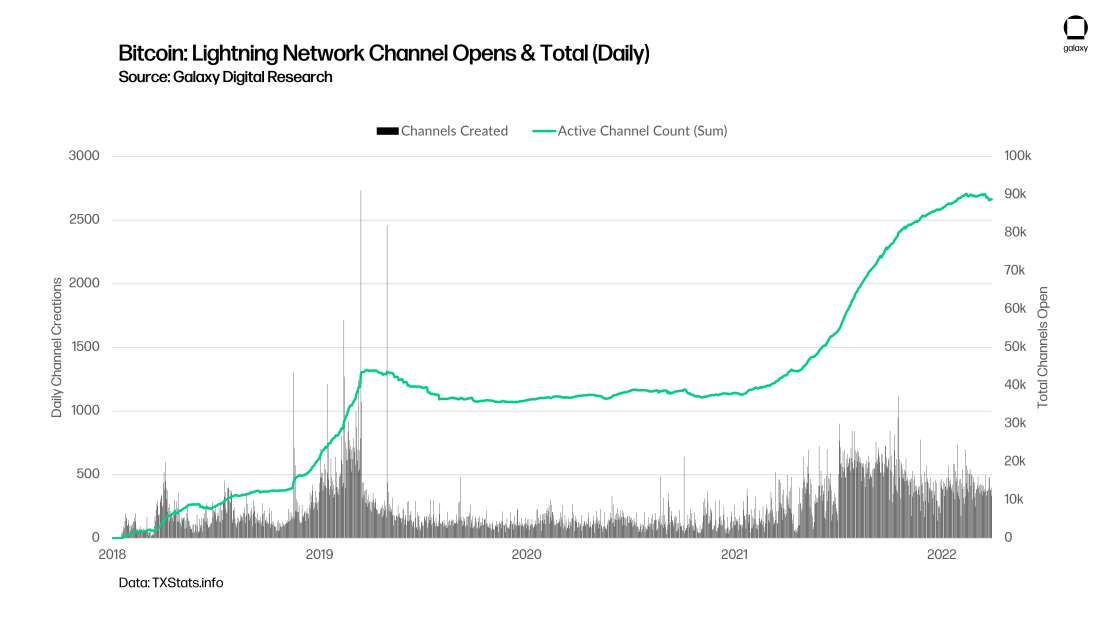
Also around the time of the start of the current low-fee environment, activity on Bitcoin’s Lighting Network increased significantly. The Lightning Network is a messaging protocol that allows two parties to lock BTC on-chain and create off-chain payment channels inside which they may transact infinitely between themselves at near-zero cost and rapid speed (hence the name “Lightning”). The chart below shows a significant increase in new, public Lightning Network channels in June 2021, each of which requires an on-chain Bitcoin transaction. While these do represent an increase in on-chain transactions which take up block space, Lightning Network channels can host many off-chain economic transactions for each single on-chain creation transaction (1 to many). While public channels and value locked in those channels has increased significantly, the nature of Lightning is such that it is impossible for an outside observer to calculate the total number of payments conducted or economic activity supported. Lightning channels are bilateral, and data is not published to a public blockchain except at the point of channel creation or closure. While it’s impossible to quantify the number of payments or amount of economic activity powered by the Lightning Network, we nonetheless view the growth of Lightning channels as indicative of growing demand for highly efficient bitcoin transactions that may be replacing on-chain transactions and therefore keeping the total on-chain transaction count suppressed.

Conclusion
In prior years, Bitcoin’s transaction fees have been the topic of much consternation from users and criticism from opponents and competitors. But since June 2021, Bitcoin transaction fees have been essentially at all-time lows. Indeed, in native terms, it’s never been less expensive to transact on Bitcoin. But unlike prior periods of low fees, the current low-fee environment is defined by significant adoption of scaling technologies and understandable changes in user behavior rather than a decline in demand for access to the Bitcoin network. And we’ve already seen that during a major speculative bull run (in Fall 2021), the efficiency gains delivered by these scaling technologies were effective at doing something that has never been possible: keeping fees at record lows even as BTCUSD raced to all-time highs.
On the scaling front, adoption of Segregated Witness, transaction batching, and the Lightning Network are all contributing to a more efficient use of block space that reduces fee pressure and increases the economic density of transactions. That these technologies are finally reaching significant levels of adoption and bringing with it visible efficiency gains for the entire network is a major achievement for Bitcoin developers and those who advocated for a scaling approach based on transaction compression rather than the blockchain expansions advocated by “big blockers” in years past.
In addition to scaling, changes in user behavior have also contributed to the low fee environment. The virtual abandonment of Tether on Bitcoin’s Omni Network and the disappearance of the VeriBlock network, each of which were heavy users of OP_RETURN transactions, has relieved the network of a major source of transactional demand. And the migration of hashrate to publicly traded companies in the United States, which may tap capital markets to raise debt and equity financing rather selling their coins, also appears to have reduced miner transaction activity.
All of this has resulted in the current situation where Bitcoin fees are at record lows, significantly improving the transactional experience for users. But some analysts worry that high fees will be required in the future to compensate miners for securing the network as the block subsidy continues halving and eventually disappears. If that is true, then perhaps the current low-fee environment should be considered a short-term benefit but long term risk. For now, we leave discussion of the future of Bitcoin’s security budget for a future paper.
Legal Disclosure:
This document, and the information contained herein, has been provided to you by Galaxy Digital Holdings LP and its affiliates (“Galaxy Digital”) solely for informational purposes. This document may not be reproduced or redistributed in whole or in part, in any format, without the express written approval of Galaxy Digital. Neither the information, nor any opinion contained in this document, constitutes an offer to buy or sell, or a solicitation of an offer to buy or sell, any advisory services, securities, futures, options or other financial instruments or to participate in any advisory services or trading strategy. Nothing contained in this document constitutes investment, legal or tax advice or is an endorsementof any of the digital assets or companies mentioned herein. You should make your own investigations and evaluations of the information herein. Any decisions based on information contained in this document are the sole responsibility of the reader. Certain statements in this document reflect Galaxy Digital’s views, estimates, opinions or predictions (which may be based on proprietary models and assumptions, including, in particular, Galaxy Digital’s views on the current and future market for certain digital assets), and there is no guarantee that these views, estimates, opinions or predictions are currently accurate or that they will be ultimately realized. To the extent these assumptions or models are not correct or circumstances change, the actual performance may vary substantially from, and be less than, the estimates included herein. None of Galaxy Digital nor any of its affiliates, shareholders, partners, members, directors, officers, management, employees or representatives makes any representation or warranty, express or implied, as to the accuracy or completeness of any of the information or any other information (whether communicated in written or oral form) transmitted or made available to you. Each of the aforementioned parties expressly disclaims any and all liability relating to or resulting from the use of this information. Certain information contained herein (including financial information) has been obtained from published and non-published sources. Such information has not been independently verified by Galaxy Digital and, Galaxy Digital, does not assume responsibility for the accuracy of such information. Affiliates of Galaxy Digital may have owned or may own investments in some of the digital assets and protocols discussed in this document. Except where otherwise indicated, the information in this document is based on matters as they exist as of the date of preparation and not as of any future date, and will not be updated or otherwise revised to reflect information that subsequently becomes available, or circumstances existing or changes occurring after the date hereof. This document provides links to other Websites that we think might be of interest to you. Please note that when you click on one of these links, you may be moving to a provider’s website that is not associated with Galaxy Digital. These linked sites and their providers are not controlled by us, and we are not responsible for the contents or the proper operation of any linked site. The inclusion of any link does not imply our endorsement or our adoption of the statements therein. We encourage you to read the terms of use and privacy statements of these linked sites as their policies may differ from ours. The foregoing does not constitute a “research report” as defined by FINRA Rule 2241 or a “debt research report” as defined by FINRA Rule 2242 and was not prepared by Galaxy Digital Partners LLC. For all inquiries, please email [email protected]. ©Copyright Galaxy Digital Holdings LP 2022. All rights reserved.


