Bitcoin Outlook as Key Levels Breached

Executive Summary
After a bearish several weeks for risk assets culminating in a particularly aggressive sell-off following Federal Reserve Chairman Jay Powell’s remarks in Jackson Hole Friday, Bitcoin is again trading below its 200-week moving average and its realized price, as it did in June. Bitcoin has traded heavy this bear market, partially due to its use as a funding asset, partly due to the outperformance of ETH. But Bitcoin is still the oldest and largest cryptoasset, and while its digital gold narrative may be faltering in the eyes of many, it's also the most decentralized and secure, most widely held, has the biggest brand, and its long-term prospects remain strong in a global world beset with declining trust in institutions.
While macroeconomic factors and monetary tightening can cause Bitcoin to trade lower in the near term, for several reasons both technical and fundamental these levels should be considered opportunistic buying opportunities for both medium and long-term Bitcoin investors.
Key Takeaways
Bitcoin is trading below both its 200w MA and realized price, which have historically proven to be opportunistic buying zones for investors with a long-term bullish view
If it trades much lower, BTC is likely to find support at the cycle low ($17,708) and 300w MA (currently $17,256)
Short- and medium-term upside targets are realized price ($21,652), 60-day MA ($22,016), and $25,000 (cycle range high)
200-week Moving Average
Historically, Bitcoin has only traded below its 200-week moving average on a handful of occasions: the depths of the 2015 bear market, the depths of the 2018/2019 bear market, the peak of fear surrounding COVID-19 in March 2020, and the current period from June 2022 through today. In the past, times when BTCUSD trades below its’ 200w MA have proven to be favorable buying opportunities across a range of time periods.

300-week Moving Average
Bitcoin has never traded below its 300-week moving average, which currently sits at $17,256, which is below Bitcoin’s current cycle low of $17,708 (June 18, 2022). Deteriorating macro conditions and broad bearishness related to central bank hawkishness could push Bitcoin down further, but both the recent cycle low ($17,708) and 300w MA ($17,256) are likely to serve as support in the case that BTC trades lower.
Realized Price
BTCUSD is also trading below Bitcoin’s realized price, a metric that seeks to calculate the average cost-basis of all coins in circulating supply. Like the 200w MA, realized price has served as a reliable indicator that markets have bottomed in the past.
Long-Term Holders
While macro conditions favor continued weakness for risk assets in the near term, anecdotal evidence suggests that traditional investors have already exited their Bitcoin positions and there is significant cash sitting on the sidelines. This is corroborated by a recent survey of Cumberland’s institutional counterparties which found that the median investor had 50% of their investment capital in cash or stablecoins. At the same time, 66% of respondents said they expect their deployment to be higher by the end of the year. Institutional investors appear to be underweight Bitcoin and crypto at the moment.
Shorter term investors may have exited, but long-term Bitcoin bulls have begun adding to their positions again, perhaps motivated by the data above as well as the powerful $20k meme (BTCUSD prior all-time high in 2017). While Bitcoin can trade lower towards the 300w MA, buying from long-term holders should provide support for Bitcoin in these ranges. We also expect that traditional and crypto-native investors will be more prone to re-deploy sidelined capital into both BTC and ETH following Ethereum’s forthcoming Merge (switch from Proof-of-Work to Proof-of-Stake), expected to take place on September 15.
Futures
This weekend’s sell-off pushed BTC’s spot-futures basis to a 1-year all time low, entering negative territory (albeit slightly) for the first time in the past year with 3-month annualized basis currently trading negative on most exchanges, ranging between –2% to slightly positive depending on the exchange. As of writing, $63mm of BTC futures have been liquidated since Friday, and $735mm have been liquidated month-to-date. While not standout figures on a historical basis, depressed spot volumes and futures open interest are important context to consider. As of Saturday, BTC futures open interest across exchanges remains at $12.8bn, roughly half of its all-time-high of $25bn observed in November 2021. From this perspective, the market has witnessed almost 6% of BTC futures open interest get liquidated over the month of August, and almost 25% since June 1st with $3bn in futures liquidations since this date.
Miner Selling
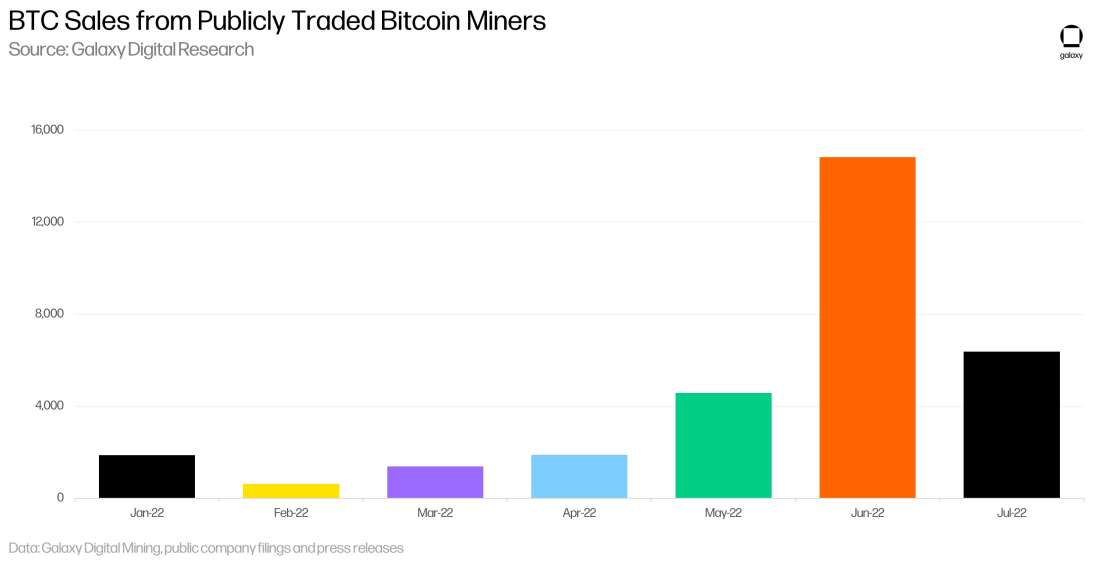
Based on ongoing reviews of filings and press releases, Galaxy’s mining team believes that BTC treasury sales from publicly traded bitcoin miners likely peaked in June 2022. The remaining public miners that possess large BTC treasuries either have large cash balances or have secured strong credit facilities. Miner capitulation is likely to continue, but future deleveraging is more likely to result in selling of machines rather than liquid BTC, based on our findings. While additional selling from miner treasuries is possible, miner treasuries are already diminished following the June 2022 market events, and thus additional pressure in spot BTC will likely be marginal. Additionally, daily BTC issuance is ~900 BTC ($18m with BTCUSD at $20k), a tiny portion of BTC’s 30-day average spot volume of $2.5bn. For more on the state of the Bitcoin mining industry, read our recent 2022 Mid-Year Bitcoin Mining Update.

Experimental Metrics
While the primary focus of this report is the key 200w MA and realized price levels, there are also some more experimental metrics that suggest BTCUSD is near a bottom.
Dormancy Flow
Some more experimental metrics also suggest that Bitcoin has found or is finding a bottom. The dormancy flow, which averages the number of coin days destroyed per coin transacted on-chain, suggests that coins transacting on the network are moving from shorter-term holders to longer-term holders. Read more about dormancy, a metric created by ARK research analyst David Puell, in this blog post. Glassnode adjusts dormancy flow by adding entity clustering, attempting to remove internal transfers between known entities. (This added filtering relies on various on-chain attribution techniques and thus should be taken with a grain of salt. Read about Glassnode’s entity clustering here).
Liveness
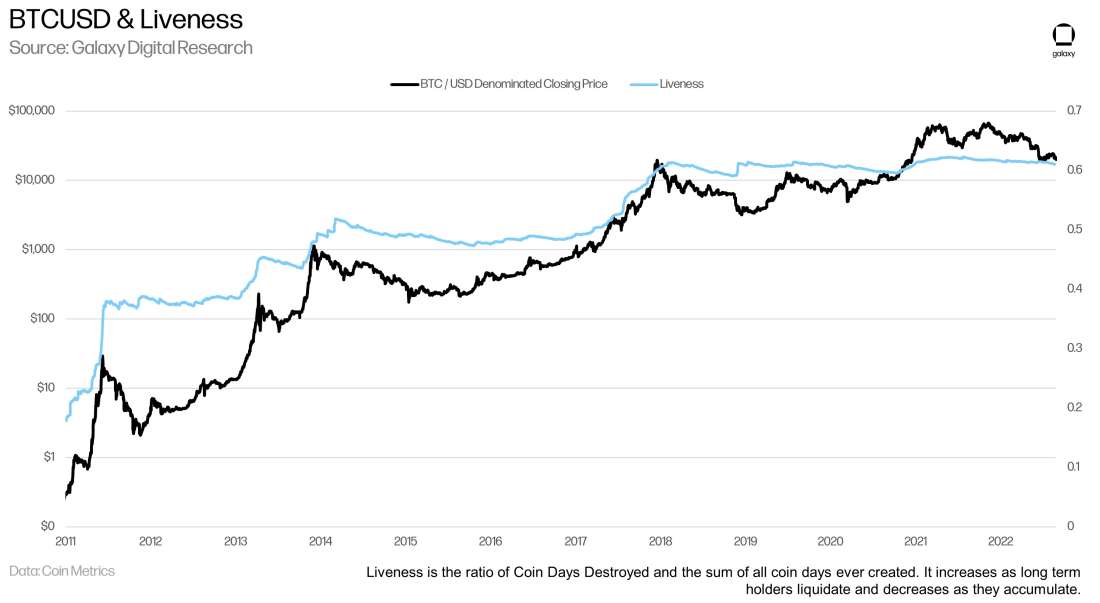
Another metric that shows long-term holders are accumulating rather than selling is Liveness, the ratio between Coin Days Destroyed and all coin days ever created. Liveness increases when long term holders liquidate and decreases when they accumulate. Recently, this metric has been trending down, further illustrating the reshuffling of coins into the hands of longer term holders.

Reserve Risk
Reserve Risk is another experimental metric that tends to peak at cycle highs and bottom at buying opportunities and is currently suggesting a favorable risk/reward ratio. This metric also uses the age of coins spent, deriving a measure of confidence on the part of long-term holders based on their likelihood to defer spending. A low Reserve Risk indicates that long-term-holder confidence is high and price is low on a relative basis, suggesting a high reward and low risk buying opportunity. This metric was developed by Hans Hauge—read more about the methodology here.
Conclusion
The biggest risks to Bitcoin’s price in the near term are macroeconomic events, monetary policy, and regulatory actions. Continued breakdown of the global economy coupled with tightening monetary policy due to persistent inflation and a strengthening dollar will weigh on risk assets like Bitcoin. However, endogenous factors impacting BTCUSD like crypto-industry deleveraging and bitcoin miner sales have likely peaked, and technical and fundamental metrics suggest relatively limited downside risk in the near term. As Summer turns to Fall, liquidity will increase across asset classes, reducing the pressure on BTCUSD. Further, as mentioned previously, Ethereum’s Merge to Proof-of-Stake has held investor attention for months and served as the primary catalyst for crypto prices this year. This upgrade is complicated and prone to risks, so the passing of this event, expected on September 15th, is likely to welcome sidelined capital back into cryptoassets including ETH and BTC. Coupled with BTCUSD trading below the key levels of the 200w MA and realized price make it an attractive opportunity for Bitcoin investors with a long-term view.
Legal Disclosure:
This document, and the information contained herein, has been provided to you by Galaxy Digital Holdings LP and its affiliates (“Galaxy Digital”) solely for informational purposes. This document may not be reproduced or redistributed in whole or in part, in any format, without the express written approval of Galaxy Digital. Neither the information, nor any opinion contained in this document, constitutes an offer to buy or sell, or a solicitation of an offer to buy or sell, any advisory services, securities, futures, options or other financial instruments or to participate in any advisory services or trading strategy. Nothing contained in this document constitutes investment, legal or tax advice or is an endorsementof any of the digital assets or companies mentioned herein. You should make your own investigations and evaluations of the information herein. Any decisions based on information contained in this document are the sole responsibility of the reader. Certain statements in this document reflect Galaxy Digital’s views, estimates, opinions or predictions (which may be based on proprietary models and assumptions, including, in particular, Galaxy Digital’s views on the current and future market for certain digital assets), and there is no guarantee that these views, estimates, opinions or predictions are currently accurate or that they will be ultimately realized. To the extent these assumptions or models are not correct or circumstances change, the actual performance may vary substantially from, and be less than, the estimates included herein. None of Galaxy Digital nor any of its affiliates, shareholders, partners, members, directors, officers, management, employees or representatives makes any representation or warranty, express or implied, as to the accuracy or completeness of any of the information or any other information (whether communicated in written or oral form) transmitted or made available to you. Each of the aforementioned parties expressly disclaims any and all liability relating to or resulting from the use of this information. Certain information contained herein (including financial information) has been obtained from published and non-published sources. Such information has not been independently verified by Galaxy Digital and, Galaxy Digital, does not assume responsibility for the accuracy of such information. Affiliates of Galaxy Digital may have owned or may own investments in some of the digital assets and protocols discussed in this document. Except where otherwise indicated, the information in this document is based on matters as they exist as of the date of preparation and not as of any future date, and will not be updated or otherwise revised to reflect information that subsequently becomes available, or circumstances existing or changes occurring after the date hereof. This document provides links to other Websites that we think might be of interest to you. Please note that when you click on one of these links, you may be moving to a provider’s website that is not associated with Galaxy Digital. These linked sites and their providers are not controlled by us, and we are not responsible for the contents or the proper operation of any linked site. The inclusion of any link does not imply our endorsement or our adoption of the statements therein. We encourage you to read the terms of use and privacy statements of these linked sites as their policies may differ from ours. The foregoing does not constitute a “research report” as defined by FINRA Rule 2241 or a “debt research report” as defined by FINRA Rule 2242 and was not prepared by Galaxy Digital Partners LLC. For all inquiries, please email [email protected]. ©Copyright Galaxy Digital Holdings LP 2022. All rights reserved.


